
Data Analytics for In-Store Task Performance
Data Analytics for In-Store Task Performance
A dashboard to analyze, manage, and enhance in-store task performance.
An analytic solution to analyze, manage and enhance in-store task performance.
My Role
My Role
Research and Analysis
Information Architecture
Task Flows
Stakeholder Management
Research and Analysis
Information Architecture
Task Flows
Stakeholder and Project Management
Challenge
Challenge
---------------
---------------
A leading provider of retail store operations solutions offered its customers with solutions for optimized store execution across the retail space. The business challenge was that the competitors offered these solutions and we are inconsistent in our approach and wanted to remain competitive in our offering.
The users ( Gatekeeper, Store Manager, and District Manager ) of the legacy system needed to go through multiple reports to view and manage the projects.
Current behavioral model
Current behavioral model
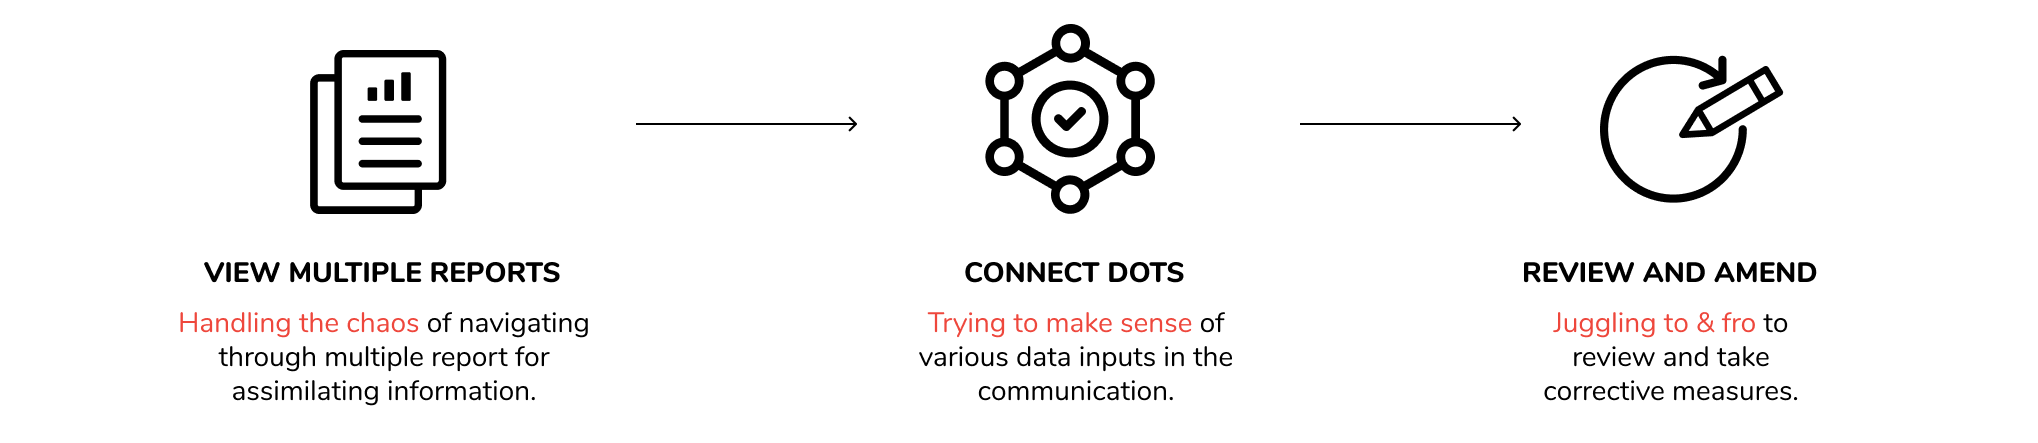
Lack of integrated real-time information led to delays in tracking instore-project completion and assigning projects in a timely manner.
As a result, it restricted the users from taking corrective actions immediately..
Lack of integrated real-time information led to delays in tracking instore-project completion and assigning projects in a timely manner.
As a result, it restricted the users from taking corrective actions immediately..
Vision - stakeholders said
Key stakeholders said
"Its not about executing, Its about understanding where you may not be executing effectively."
"Its not about executing, Its about understanding where you may not be executing effectively."
- VP of Solution Consulting, UK
- VP of Solution Consulting, UK
"Show exactly what I want to see and nothing more!"
"Show exactly what I want to see and nothing more!"
- VP of Solution Consulting, US
- VP of Solution Consulting, US
"Walk by, glance at it, act fast!"
"Walk by, glance at it, act fast!"
- VP, Business Intelligence & Analytics
- VP, Business Intelligence & Analytics
How might we provide information that enables users in taking well informed, on-time and sound decisions for better performance?
How might we provide information that enables users in taking well informed, on-time and sound decisions for better performance?
User Research & Insights
User Research & Insights
--------------------
--------------------
Qualitative Interview
Qualitative Interview
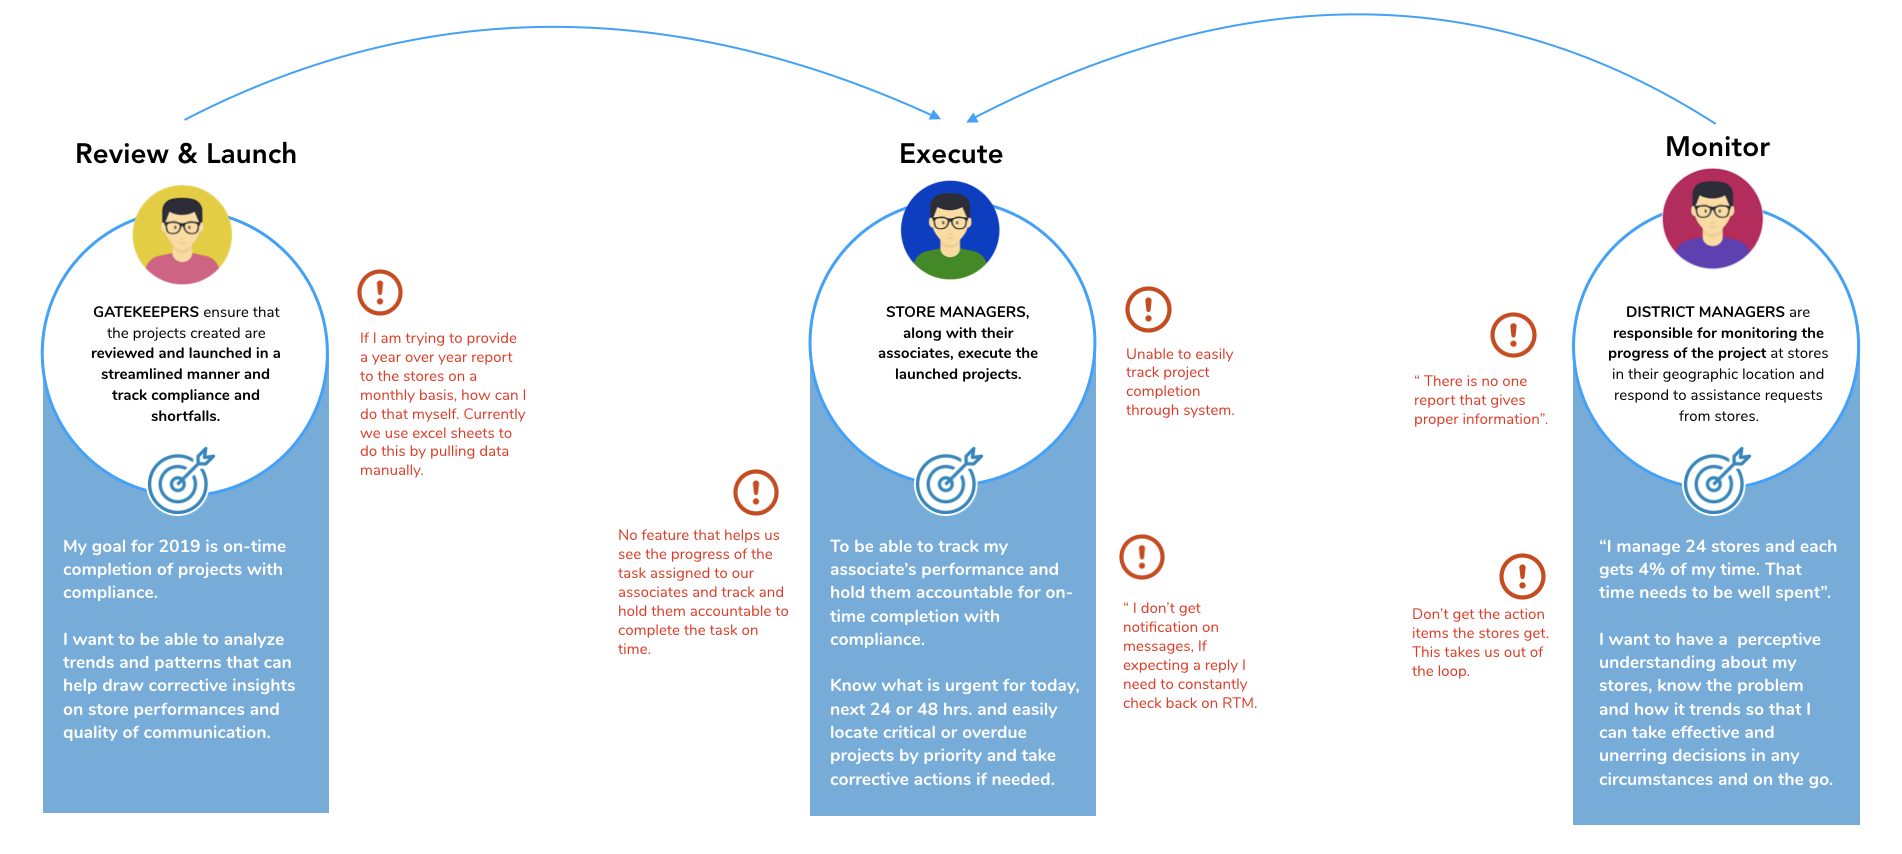
Interviewed 5 users to understand: current ecosystem, user-specific tasks, frustration/pain points and their aspiration.
Interviewed 5 users of each user type to understand: current ecosystem, user-specific tasks, frustration/pain points and their aspiration.
" Looking at reports that aren’t easy to read is a waste of time. It should be from a summary to a detailed view and not the other way".
" Looking at reports that aren’t easy to read is a waste of time. It should be from a summary to a detailed view and not the other way".
"We, (district managers), don’t get the action items the stores get. This keeps us out of the loop."
"We, district managers, don’t get the action items the stores get. This keeps us out of the loop."
" We ( store managers ) are unable to track project completion and hold our associates accountable for the task assigned to them."
" We are unable to track project completion and hold our associates accountable for the task assigned to them."
" There is no one report that gives proper information on completion and performance.
" There is no one report that gives proper information. This makes it difficut to track yearly, quartery or monthy trends in performance.
Key Learnings from Research
Key Learnings from Research
1.
1.
Being compliant is a foremost lookout. Hence users are keen on information that stands out or differs from the norm and further elicits their attention to dig deeper into insights.
Being compliant is a foremost lookout. Hence users are keen on information that stands out or differs from the norm and further elicits their attention to dig deeper into insights.
2.
2.
Users expect to get constant updates on key information coupled with crisp insights/reasons that help them to scan through the performance of their stores.
Due to the on-the-go lifestyle, users expect to get constant updates on key information coupled with crisp insights/reasons that help them to scan through the performance of their stores.
3.
3.
District Managers especially have a narrow scope of attention while dealing with multiple stores hence, they are only interested in the succinct level of information that can help them in quick decision making.
District Managers especially have a narrow scope of attention while dealing with multiple stores hence, they are only interested in the succinct level of information that can help them in quick decision making.
4.
4.
At the analytical level, the intent of understanding problems and their reasons is to kill the source of the problem than just amending it from time to time.
At the analytical level, the intent of understanding problems and their reasons is to kill the source of the problem than just amending it from time to time.
Design Direction / Solution
Design Direction / Solution
--------------------
--------------------
User's mental model redefined.
User's mental model redefined.
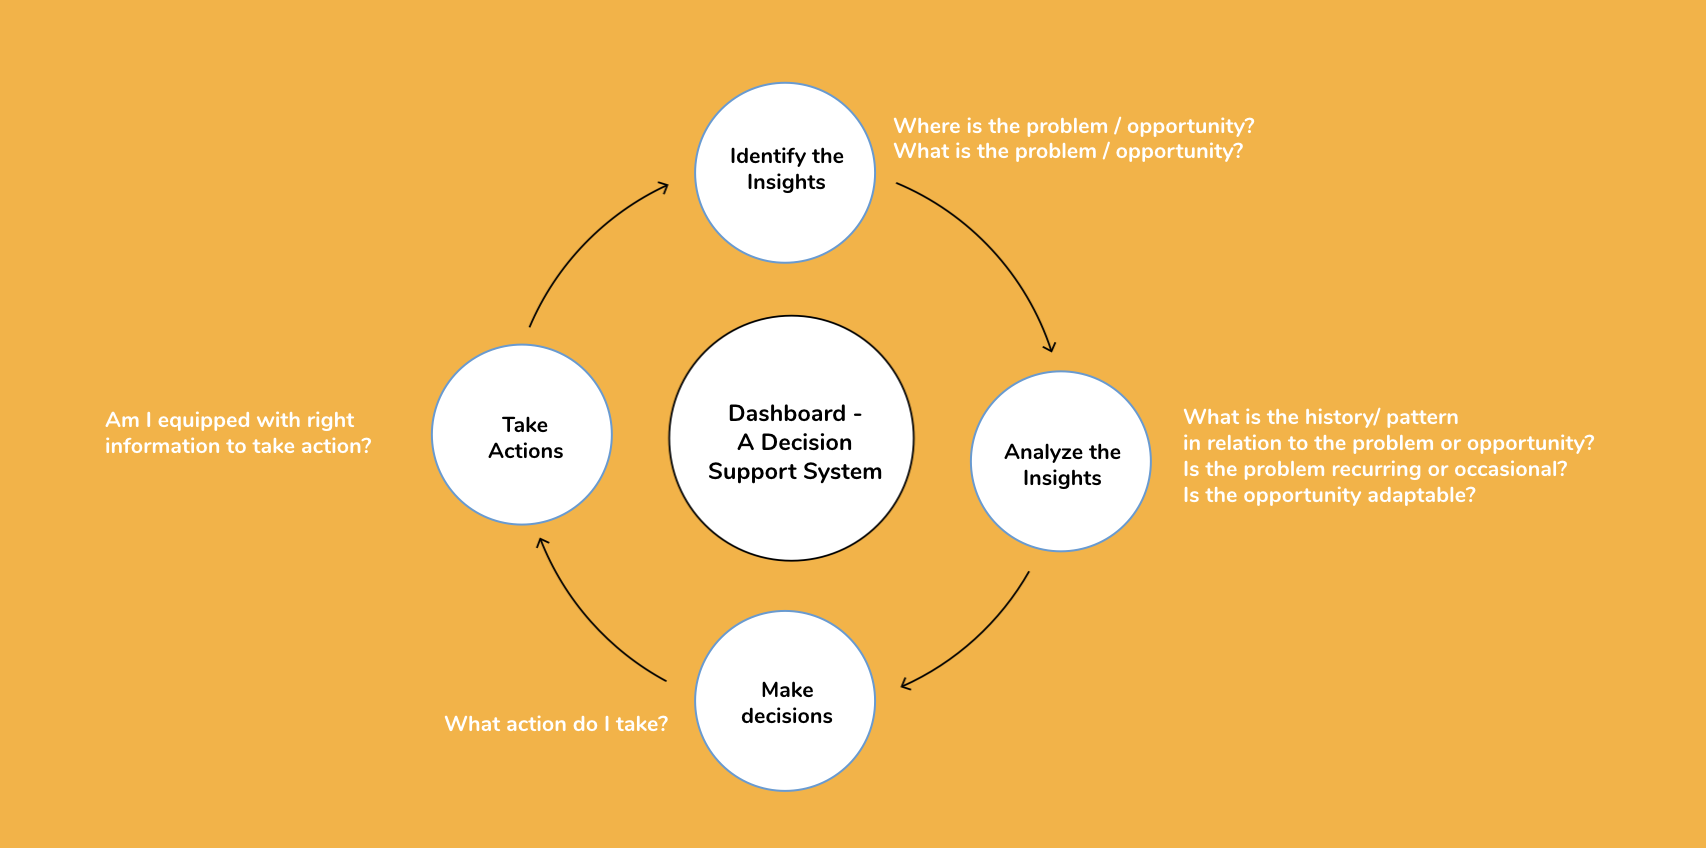
Based on understanding what the user's aspire to efficiently execute their tasks, we redefined the mental model in a way that the dashboard acts as a decision support system. This helps them to easily understand the data and quickly identify areas that require their attention.
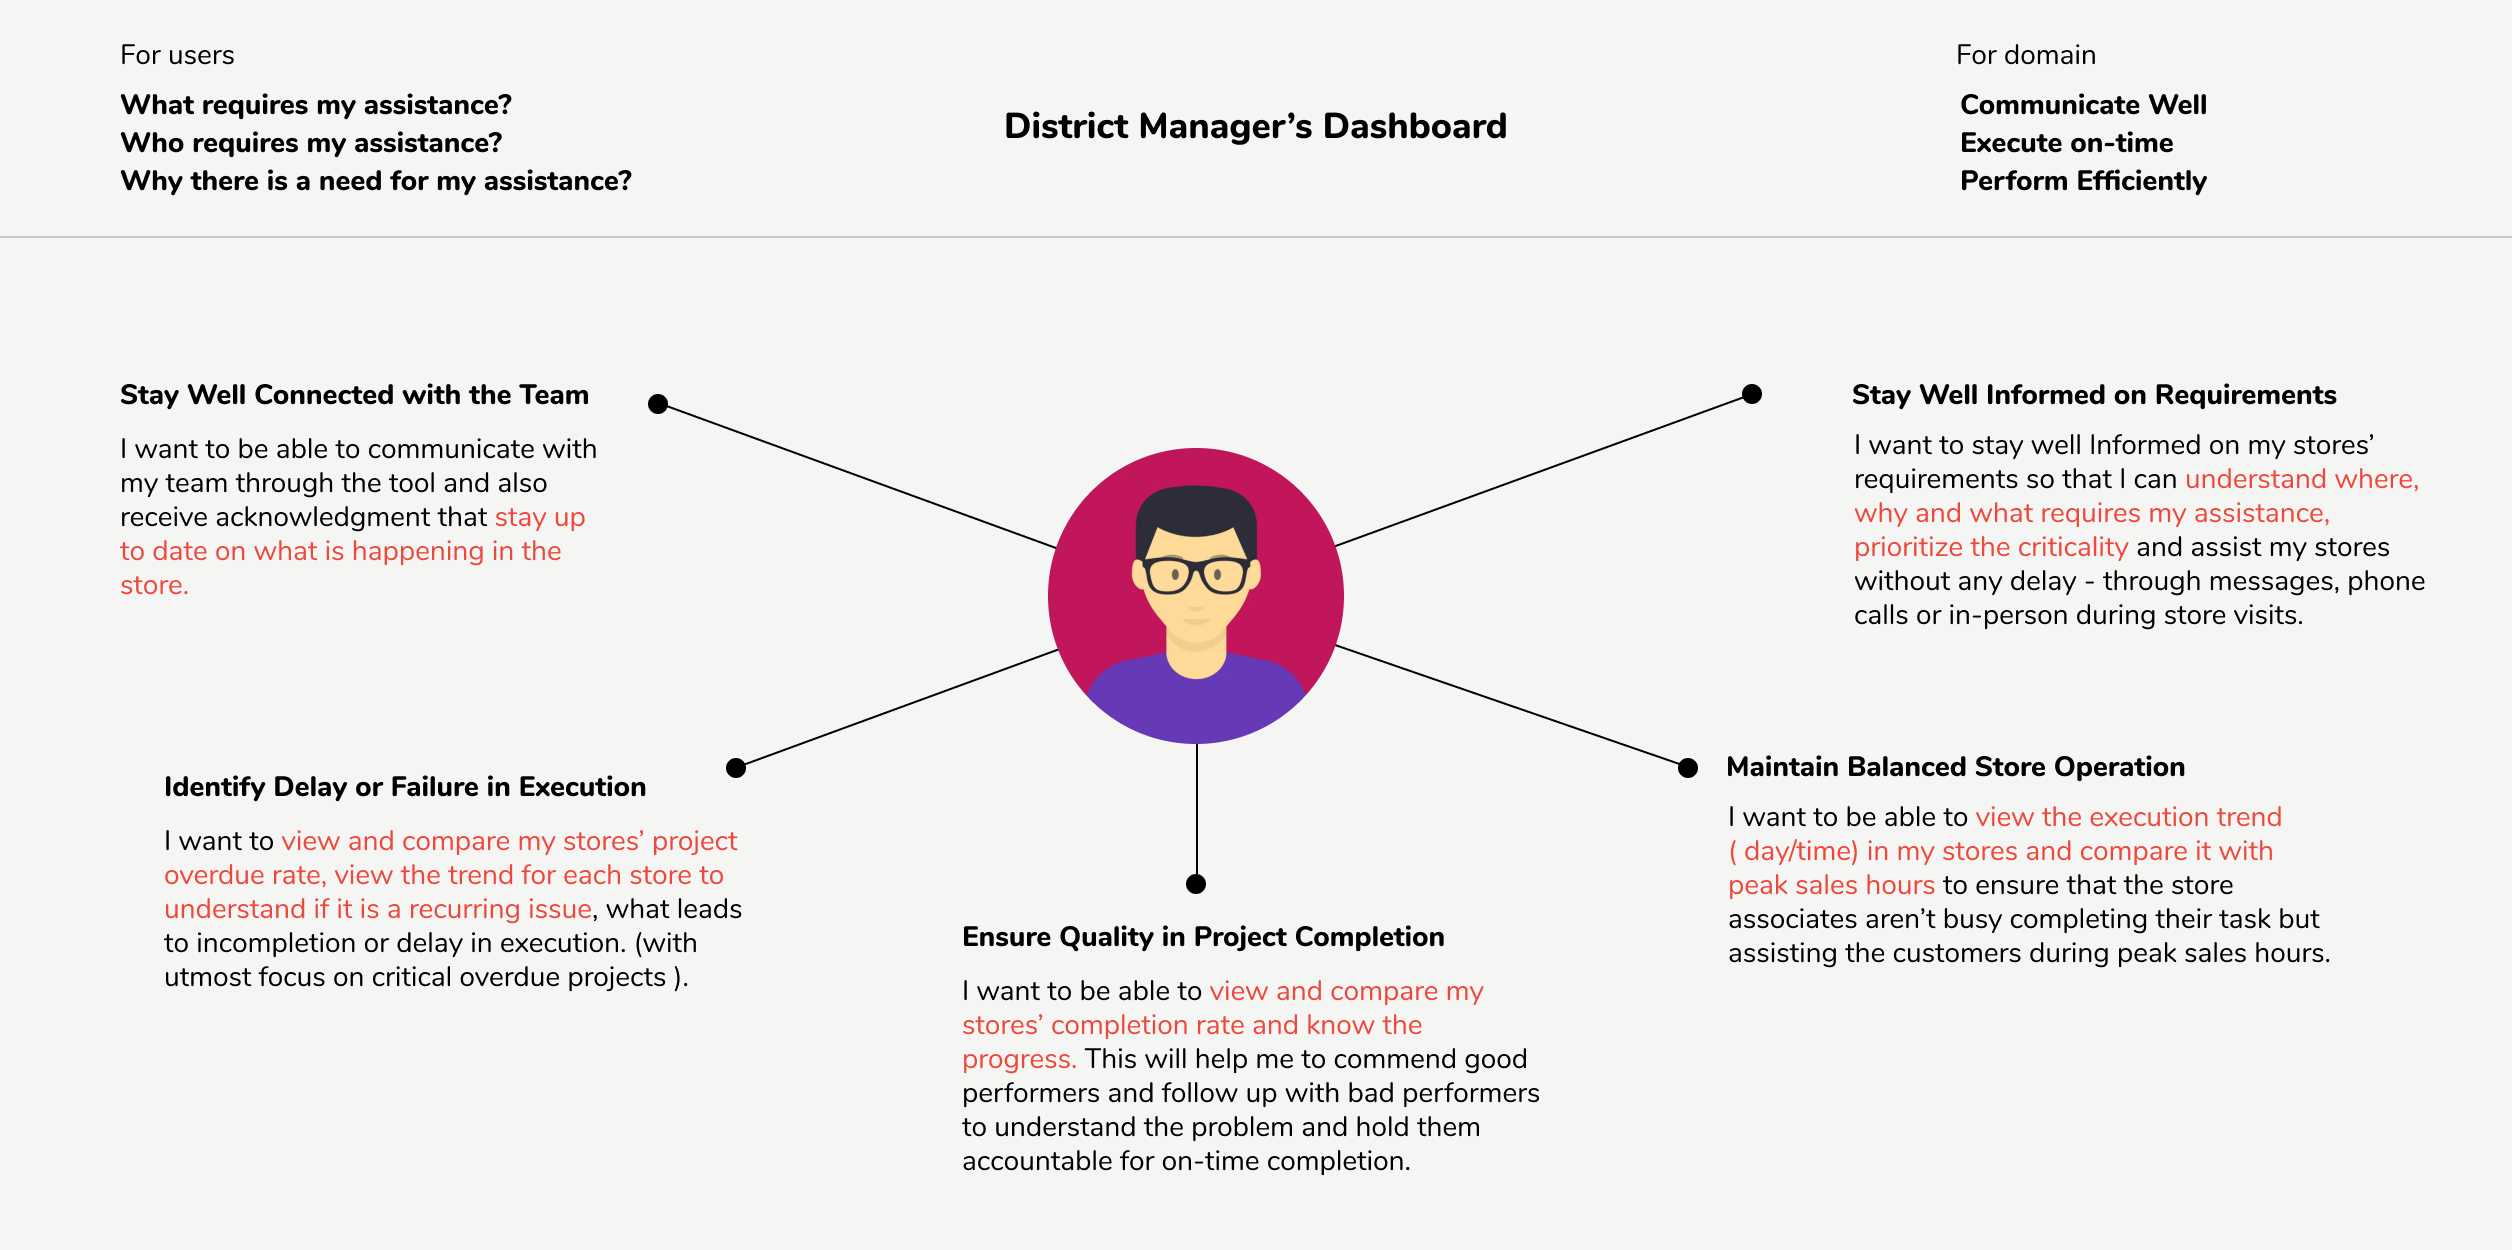
Based on understanding what the District Managers aspire to efficiently execute their tasks, we redefined the mental model in a way that the dashboard acts as a decision support system. This helps them to easily understand the data and quickly identify areas that require their attention.
I was initially provided with a set of documents on the type of information that the client thought was essential for the district manager. However to make better sense out of those data I used the job stories method which helped me to map the content to tasks and scenarios - i.e, understanding the situation, motivation, and expected outcome.
I was initially provided with a set of documents on the type of information that the client thought was essential for the district manager. However to make better sense out of those data I used the job stories method which helped me to map the content to tasks and scenarios - i.e, understanding the situation, motivation, and expected outcome.
Information Architecture - Metrics
Information Architecture - Metrics
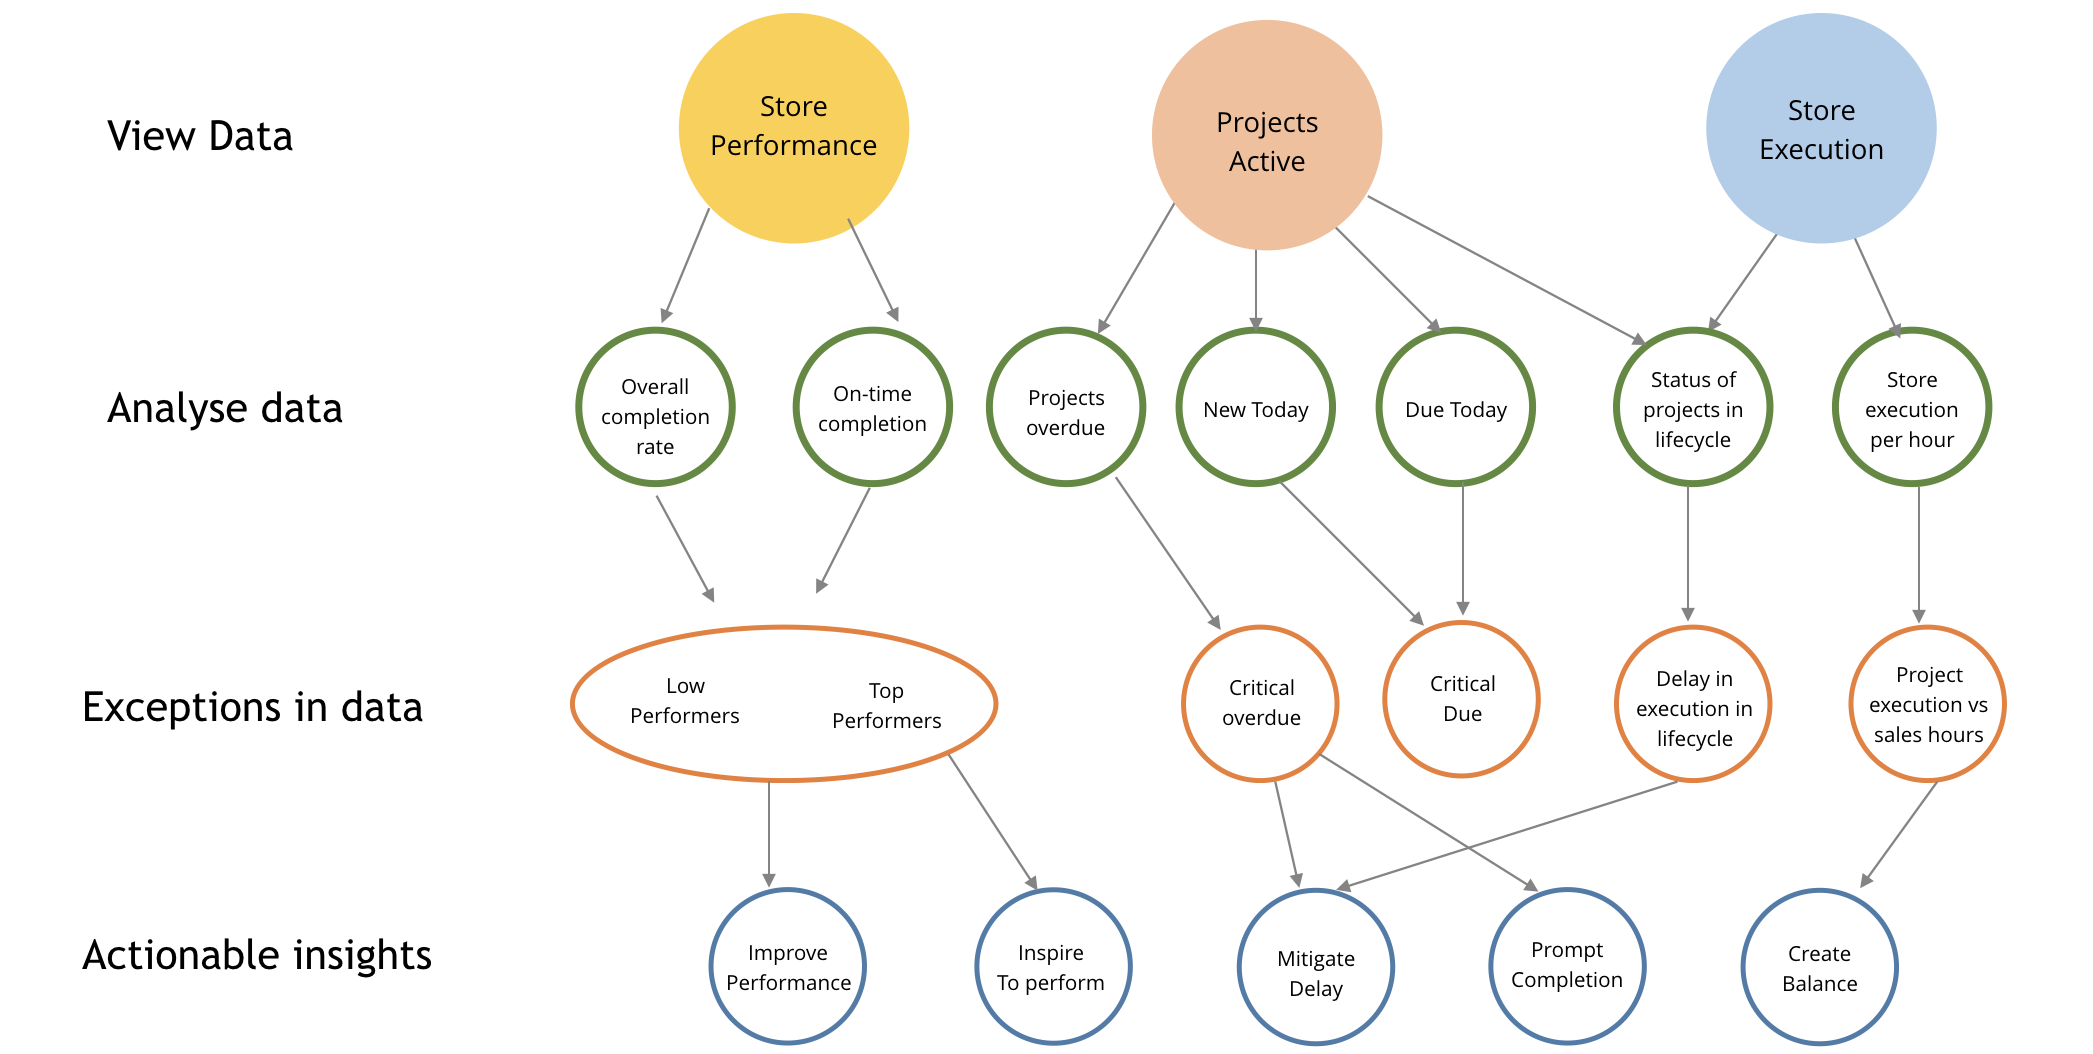
I segregated the information into 3 categories.
- Store Performance Widget - This gives District Managers insights based on the task completed helping them evaluate their performance.
- Projects Active Widget - This helps evaluate the ongoing executions in the store through the current project status.
- Store Execution Widget - This provides an hourly execution trend compared with customer traffic in-store.
Navigation Model
Information Architecture
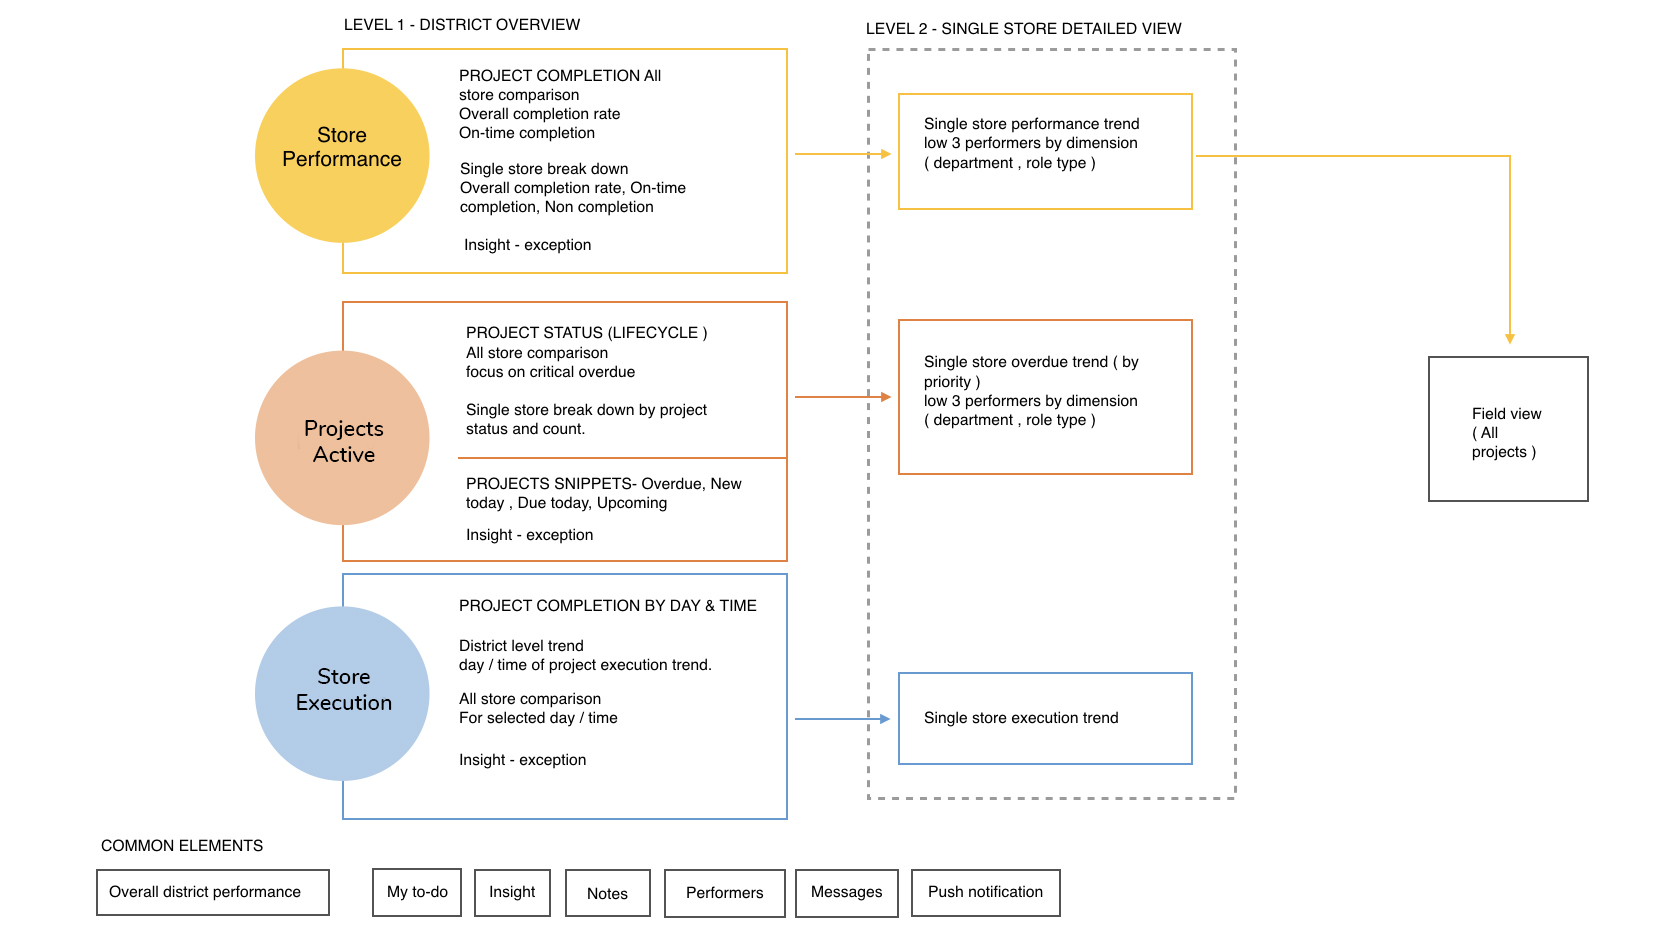
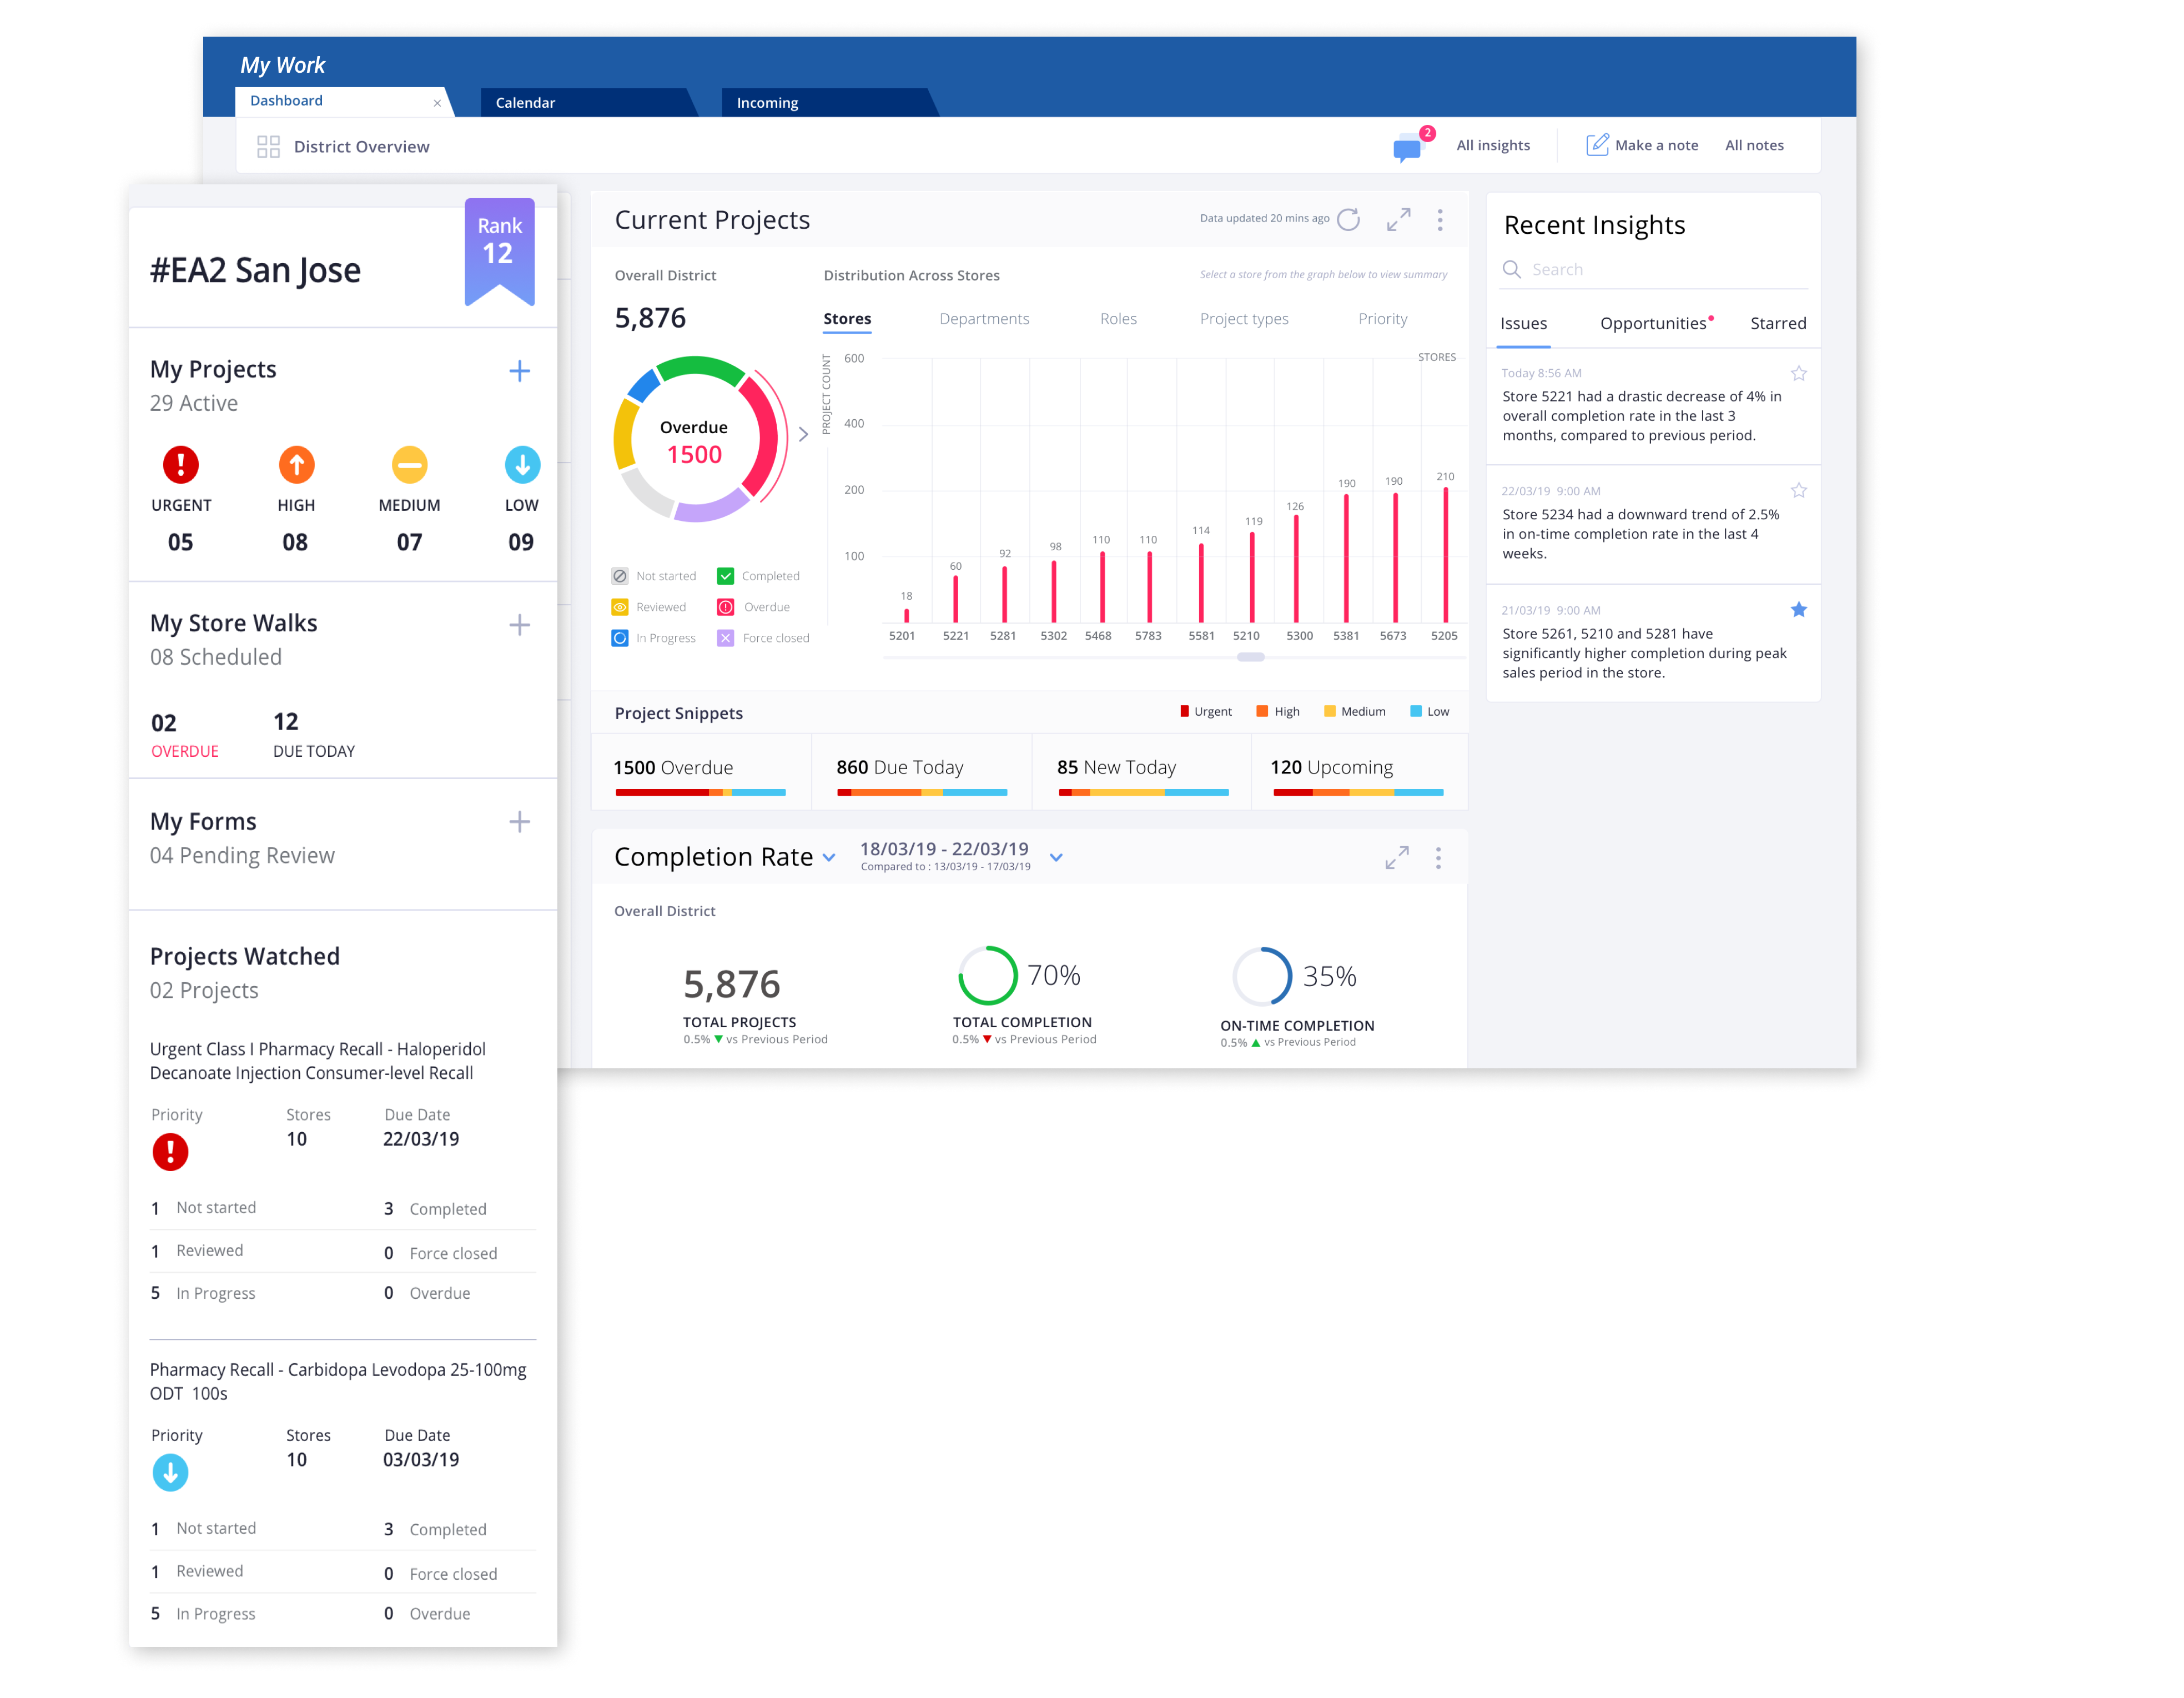
The dashboard provides the users with key information to analyze and promote in-store task performance and in turn, increase revenue and boost profitability.
An analytics solution, that provides the users with key information to analyze and promote in-store task performance and in turn, increase revenue and boost profitability.
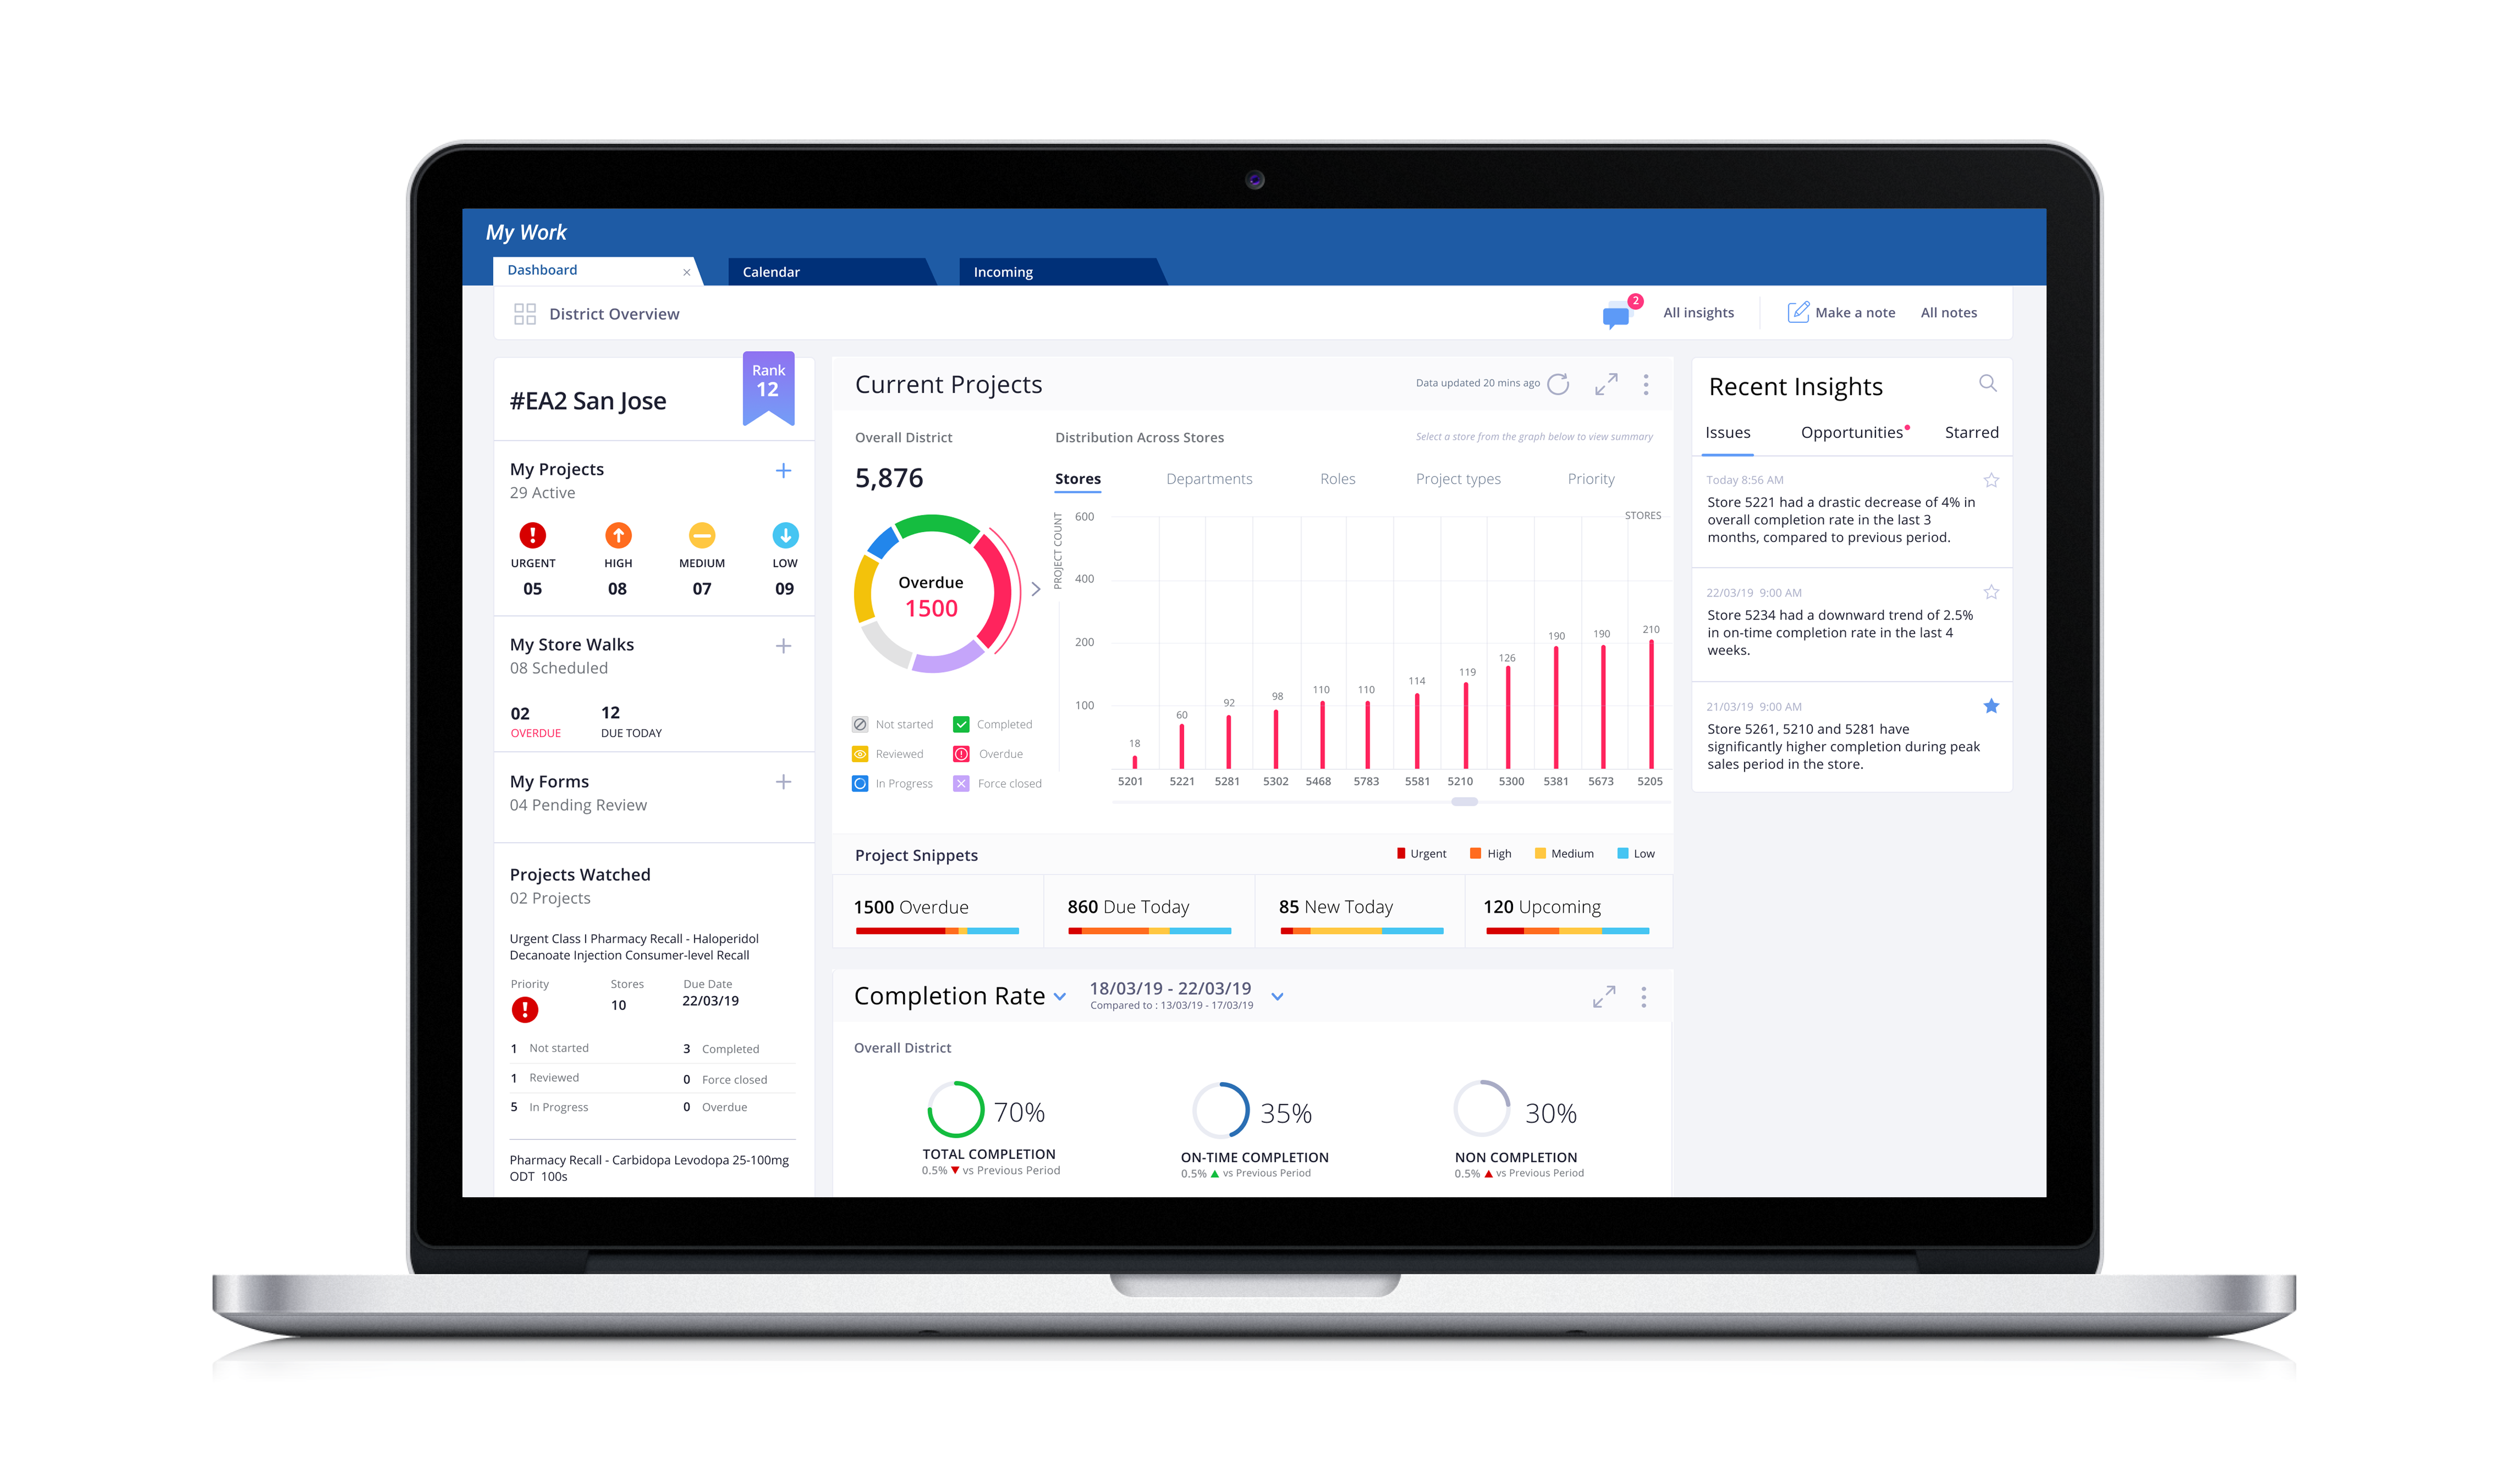
Core functionalities
Core functionalities
1. Store Metrics
1. Store Metrics
Realtime information on execution and performace trends with the ability to anlalyse in different dimensions and locate anomalies faster.
Realtime information on execution and performance trends with the ability to analyze in different dimensions and locate anomalies faster.
2. Recent Insights
2. Recent Insights
System generated insights provides quicker access to success and shortfalls across all stores. eg : Completion rate has dropped by 4% in store 0001, 0018 and 0004 due to high edits on projects.
System generated insights provides quicker access to success and shortfalls across all stores. eg : Completion rate has dropped by 4% in store 0001, 0018 and 0004 due to high edits on projects.
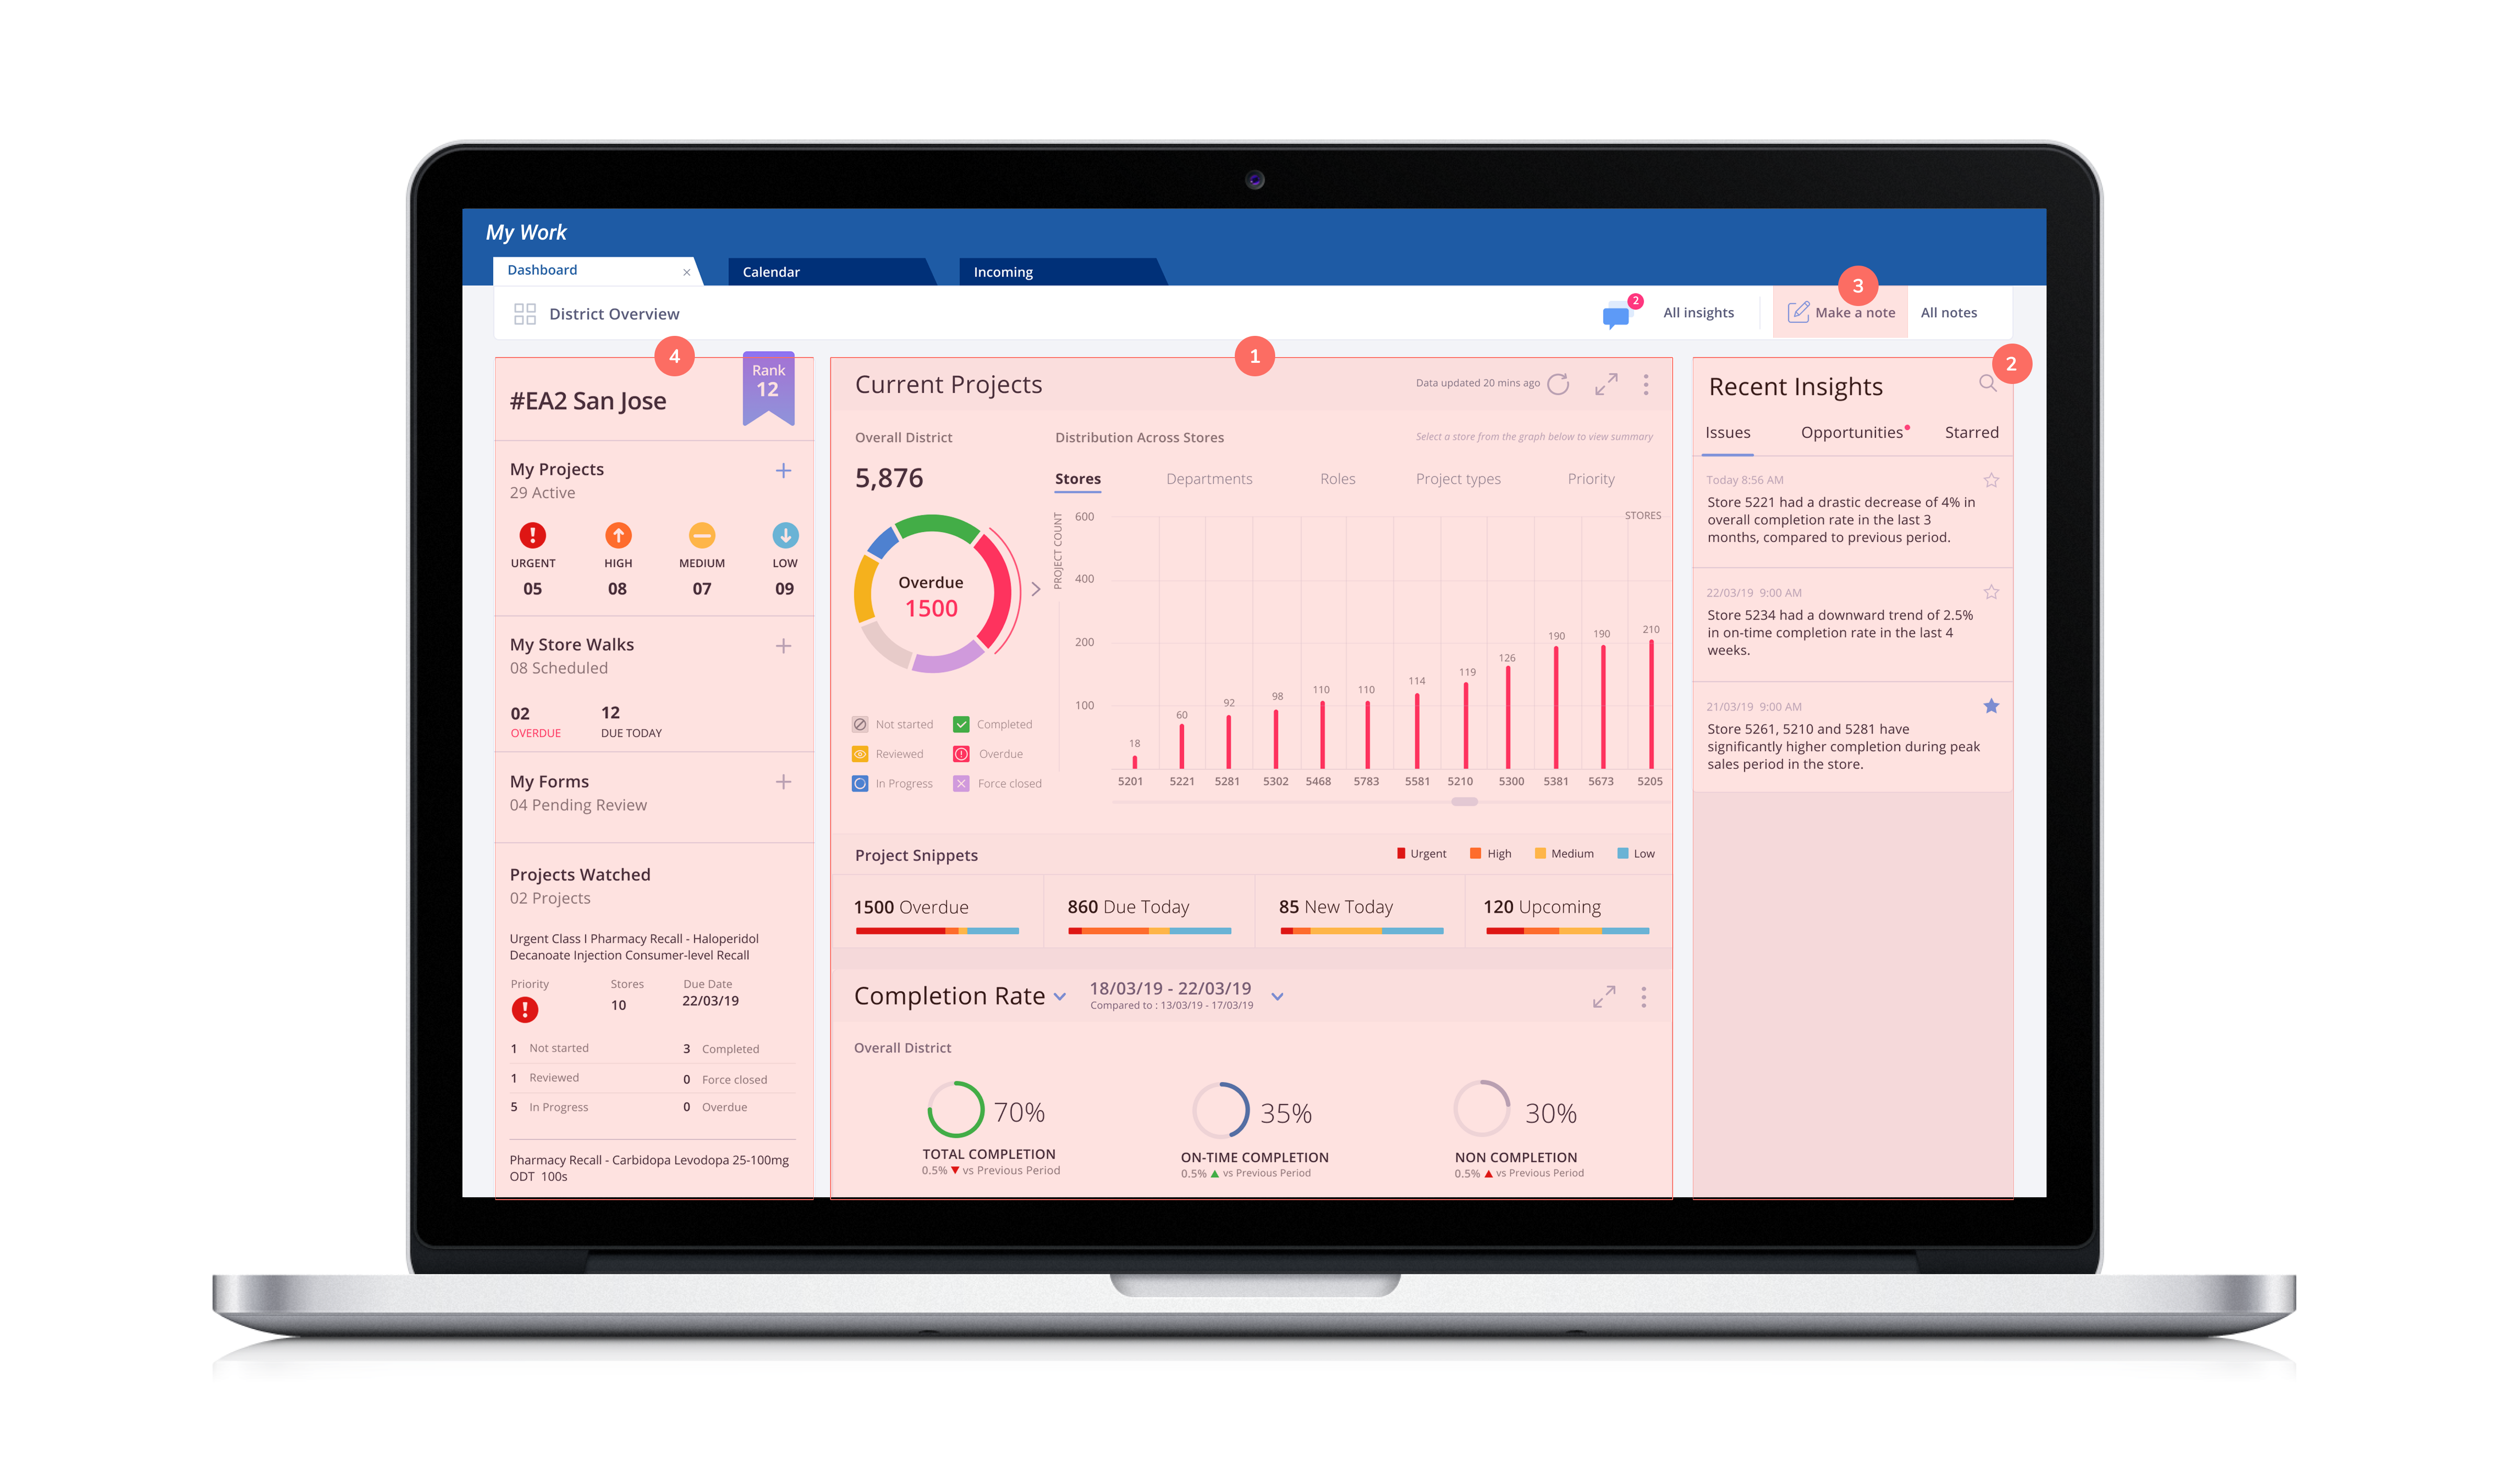
3. Make a note
3. Make a note
A custom built functionality to capture snapshots and annotate on the go.
A custom built functionality to capture snapshots and annotate on the go.
4. My to-do space
4. My to-do space
District Manager's personalised to-do information for self compliance.
District Manager's personalised to-do information for self compliance.
1. Metrics
-----------
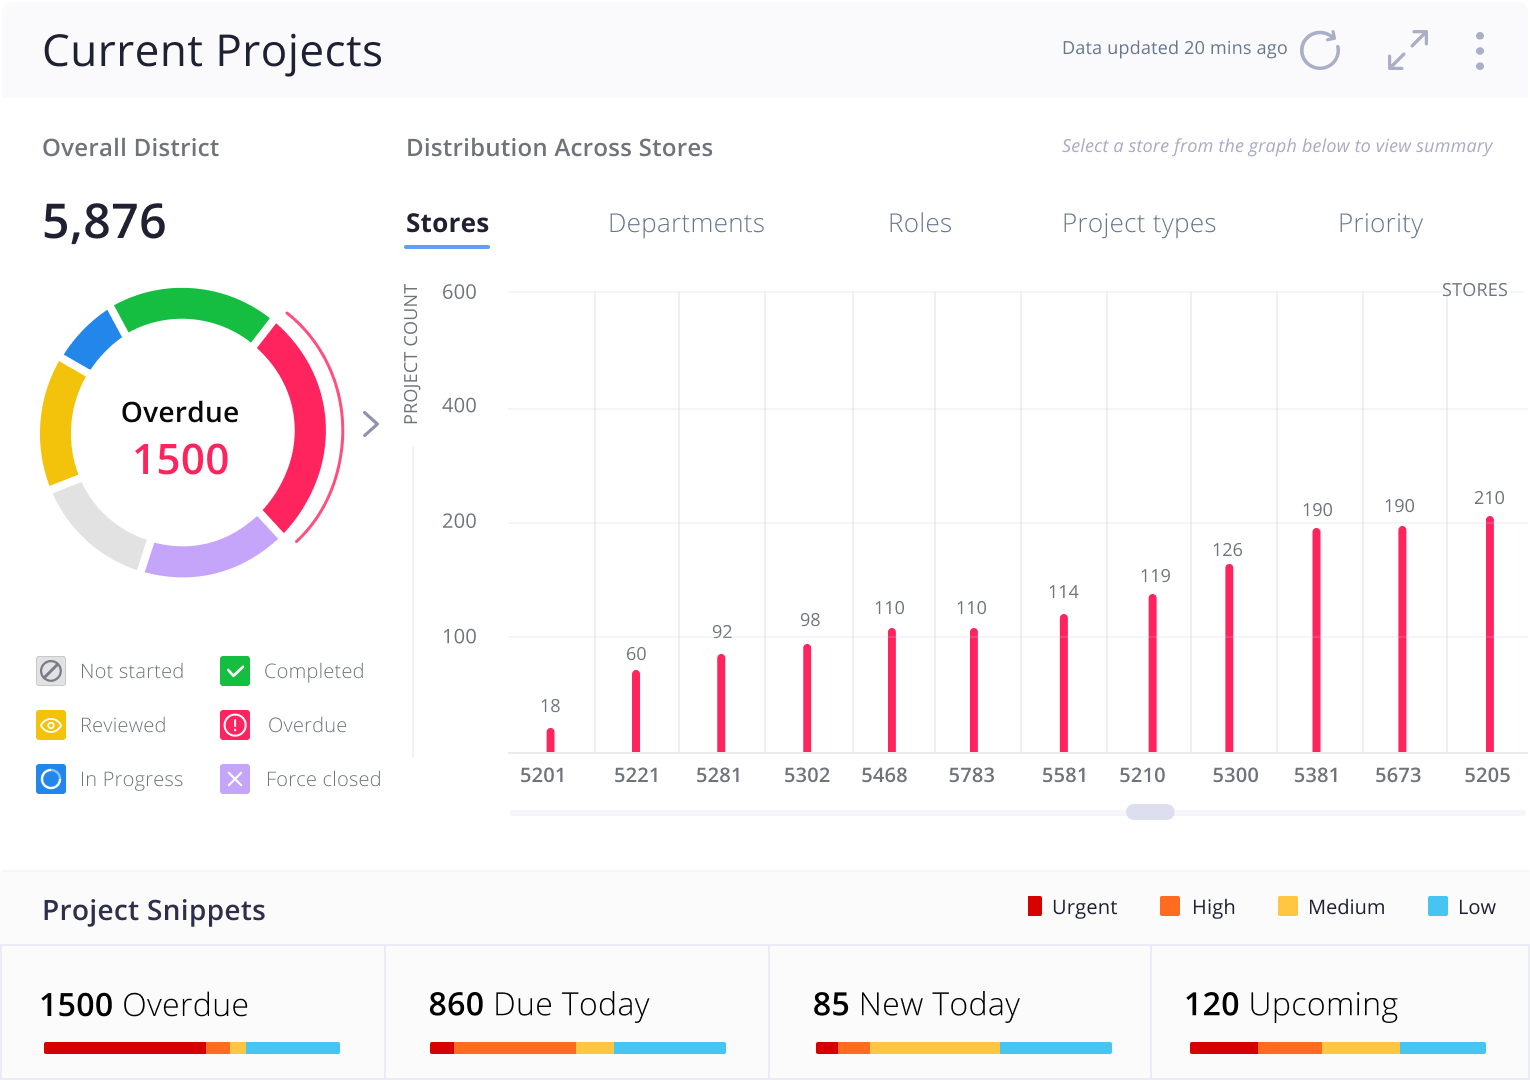
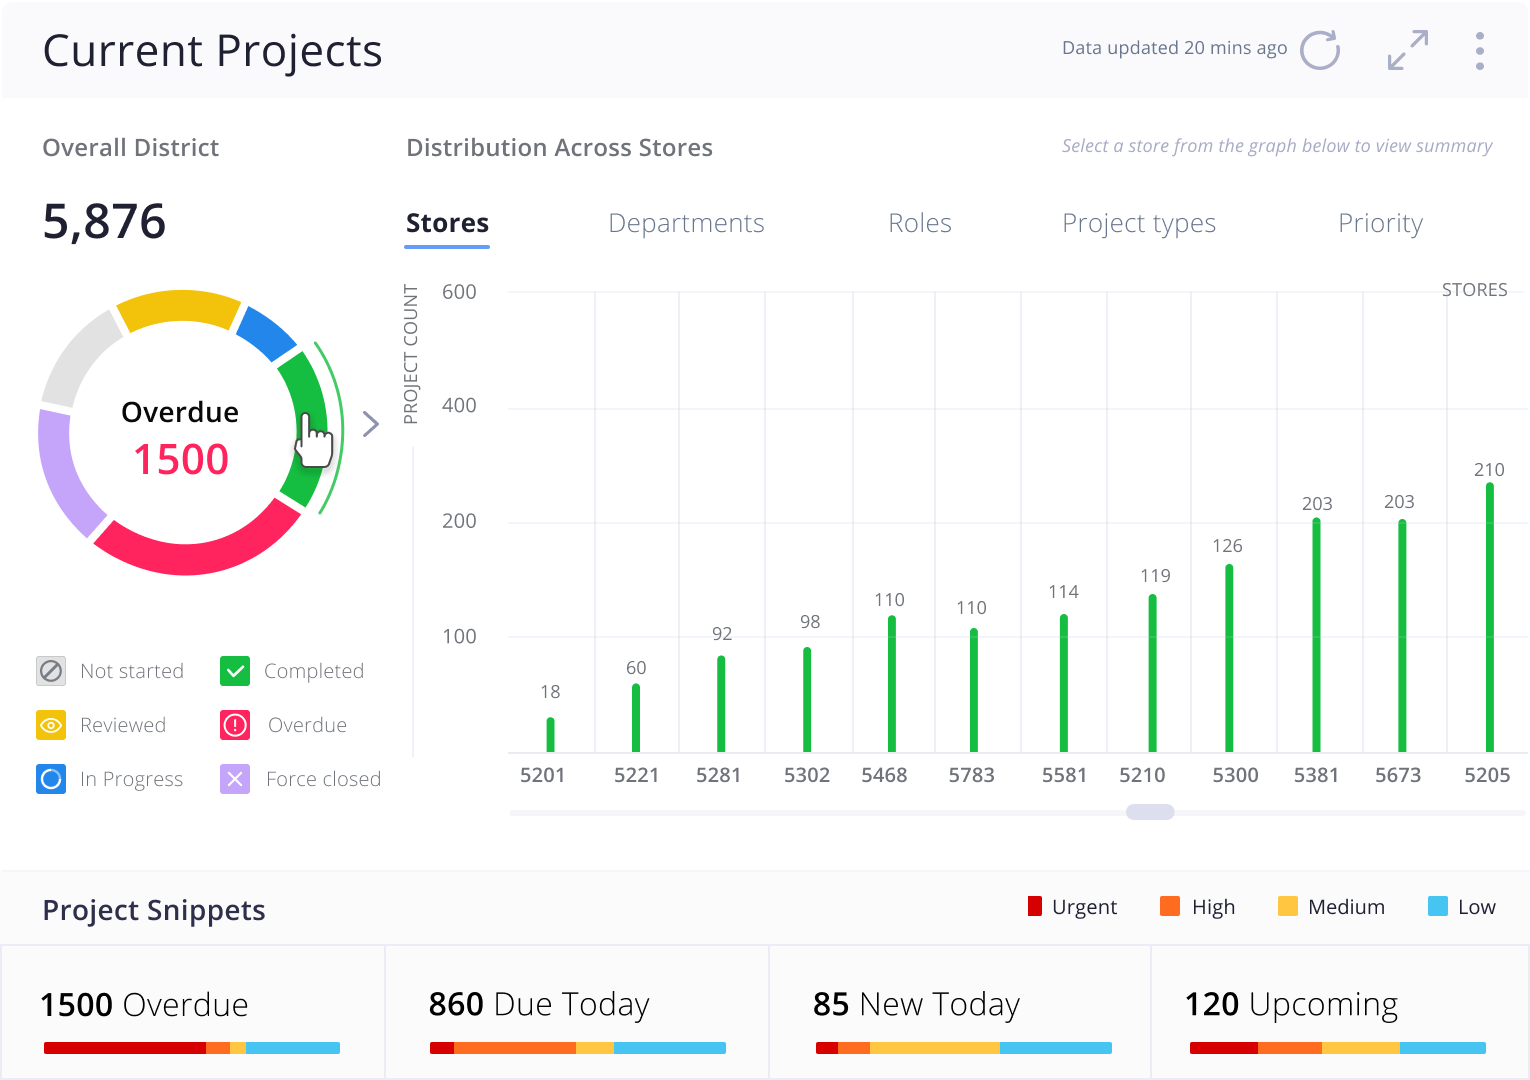
1.1 Current Projects Widget - ( Store Execution )
1.1 Current Projects Widget - ( Store Execution )
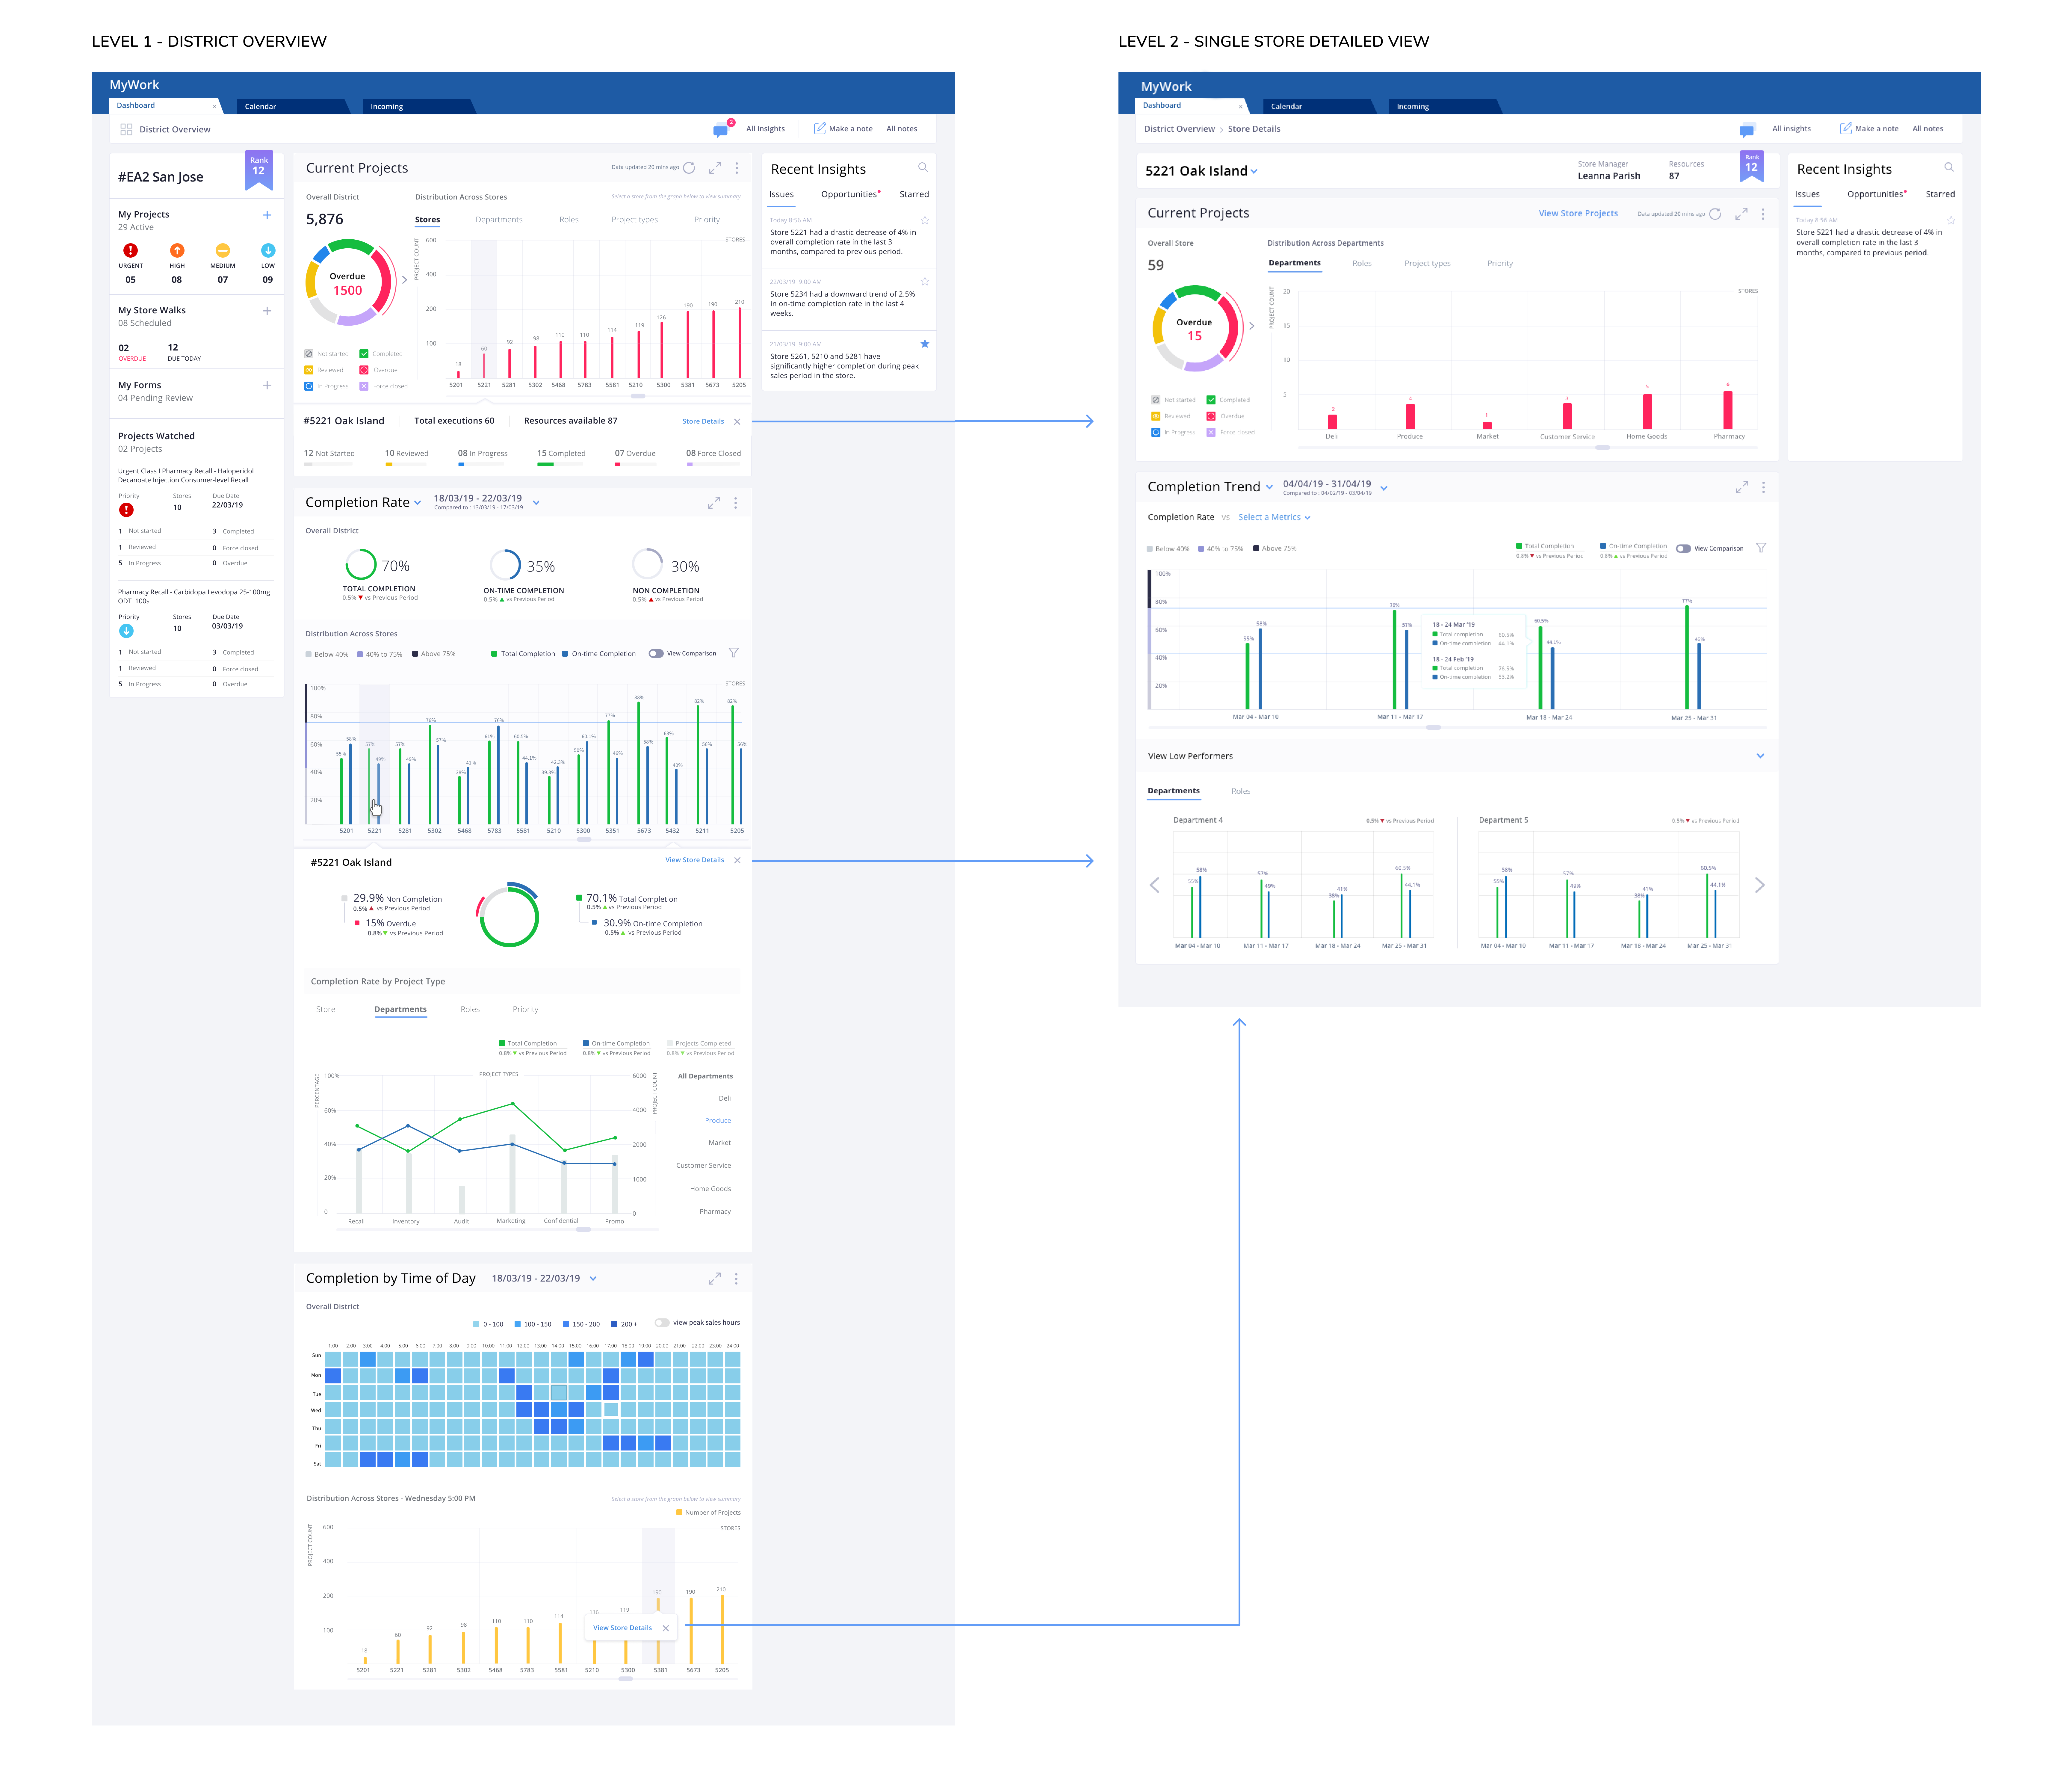
The widget gives realtime information on project distribution across stores within the districts.
- The bar chart displayed in ascending order helps the District Managers to instantly identify the project load across different stores.
- The rotating donut chart shows project distribution by status.
- District Managers can also view the project distribution by different dimensions i.e. by store, department role type, project type or priority.
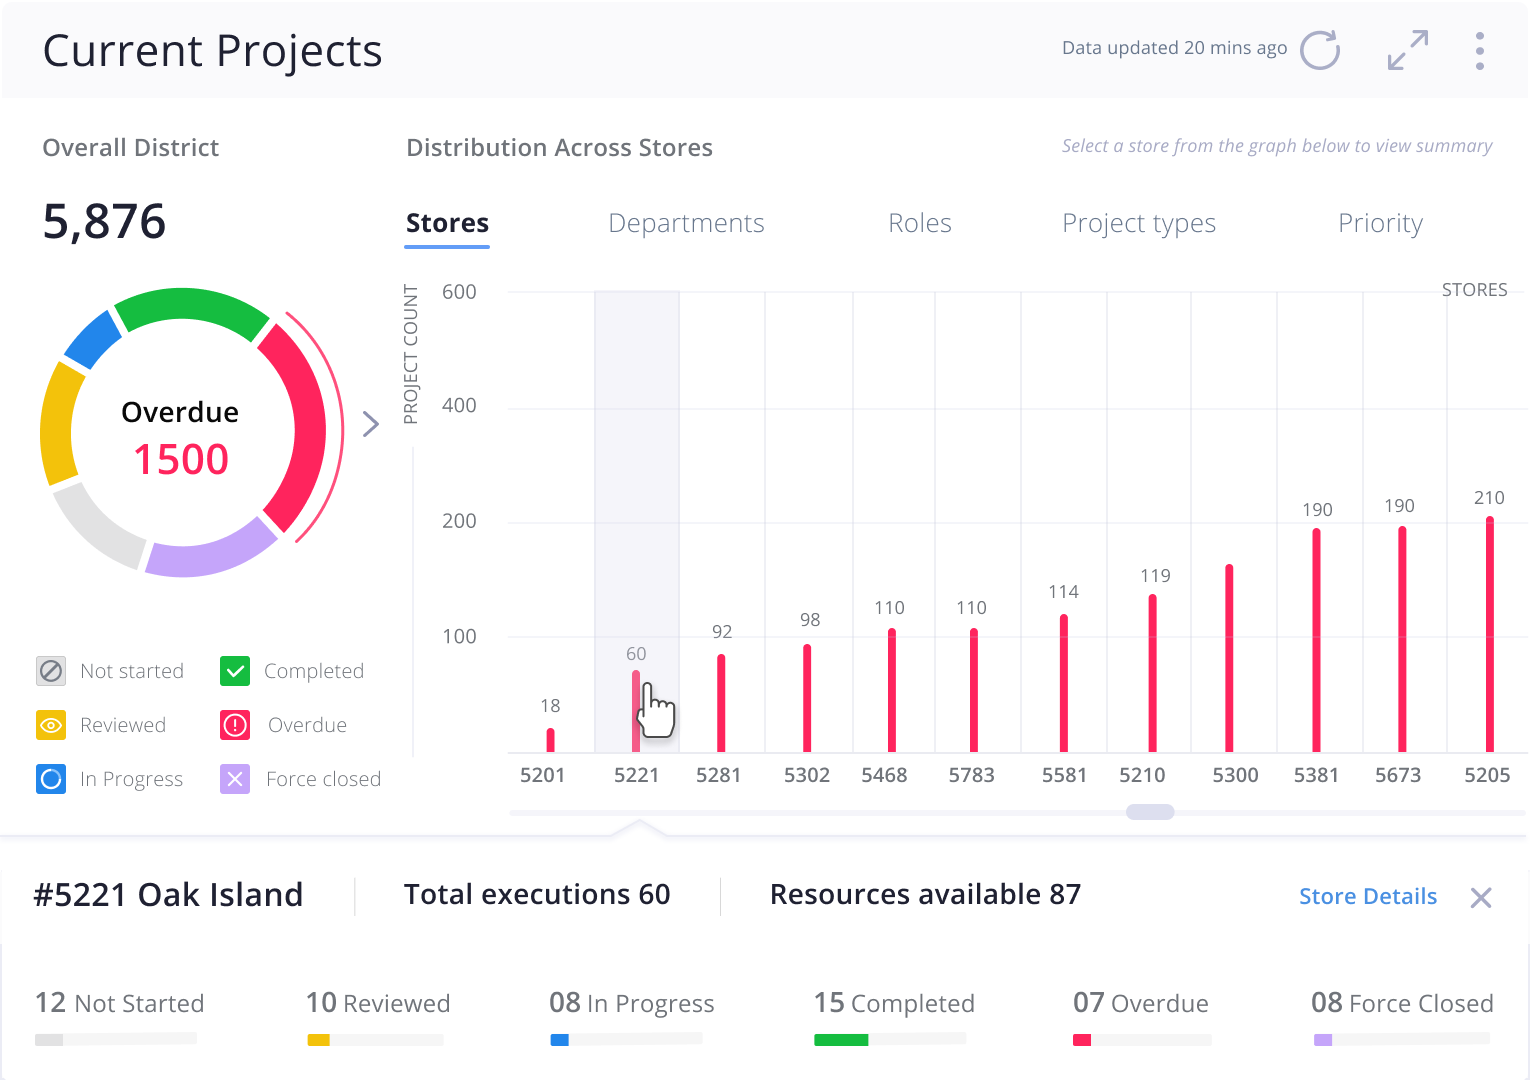
- On click of the bar/store, users are provided with a quick summary of the project status and distribution at the store level. ( image. 3 )
The widget gives realtime information on project distribution across stores within the districts.
- The bar chart displayed in ascending order helps the District Managers to instantly identify the project load across different stores.
- The rotating donut chart shows project distribution by status.
- District Managers can also view the project distribution by different dimensions i.e. by store, department role type, project type or priority.
- On click of the bar/store, users are provided with a quick summary of the project status and distribution at the store level. ( image. 3 )
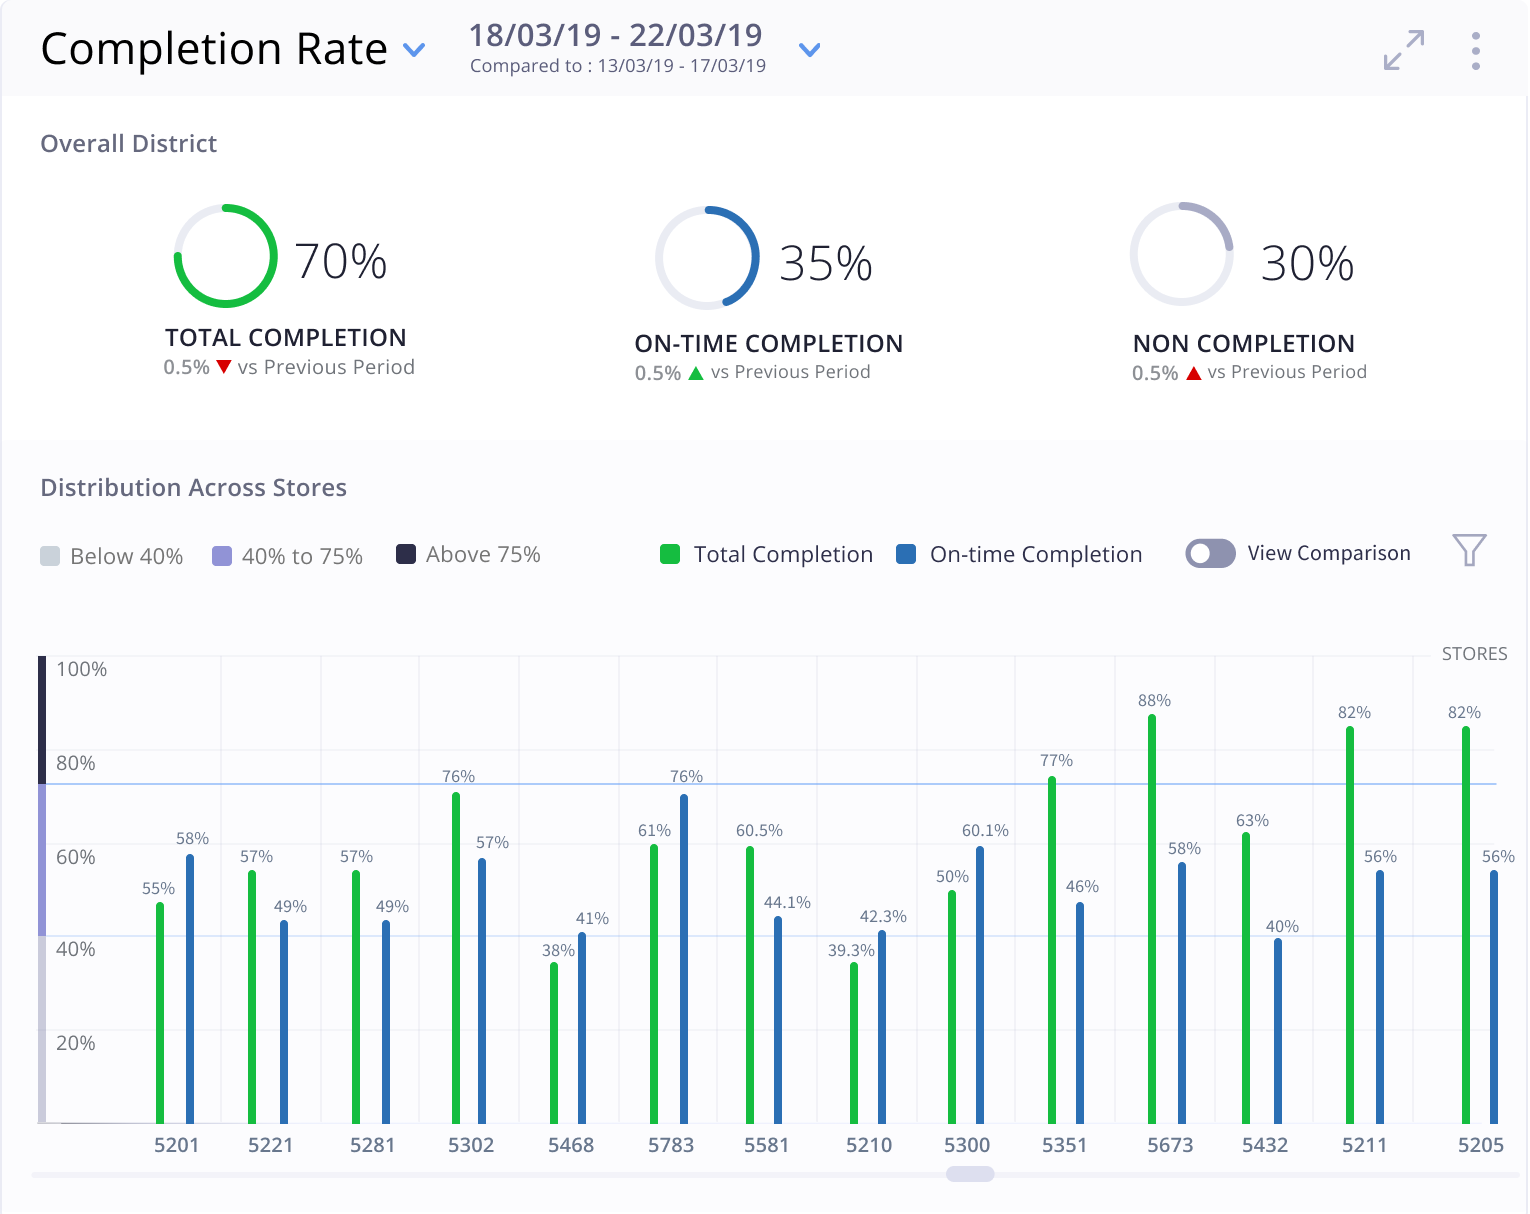
1.2 Completion Rate Widget - ( Store Performance )
1.2 Completion Rate Widget - ( Store Performance )
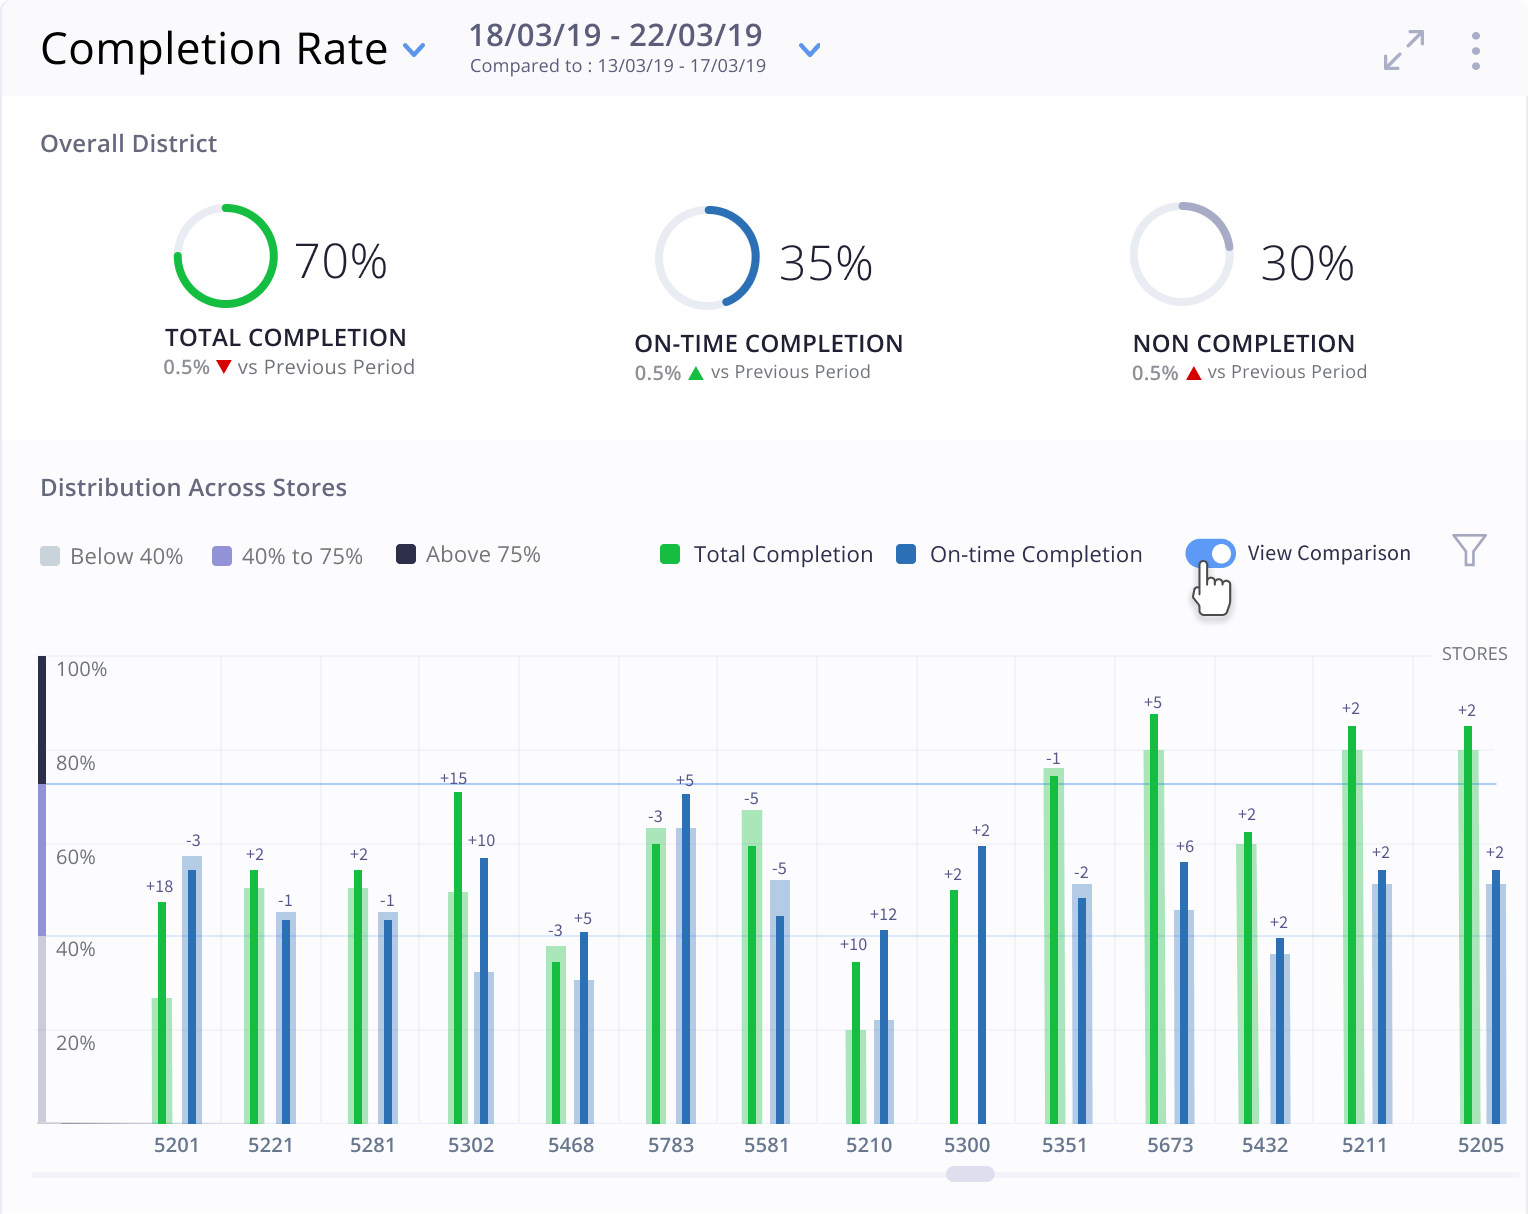
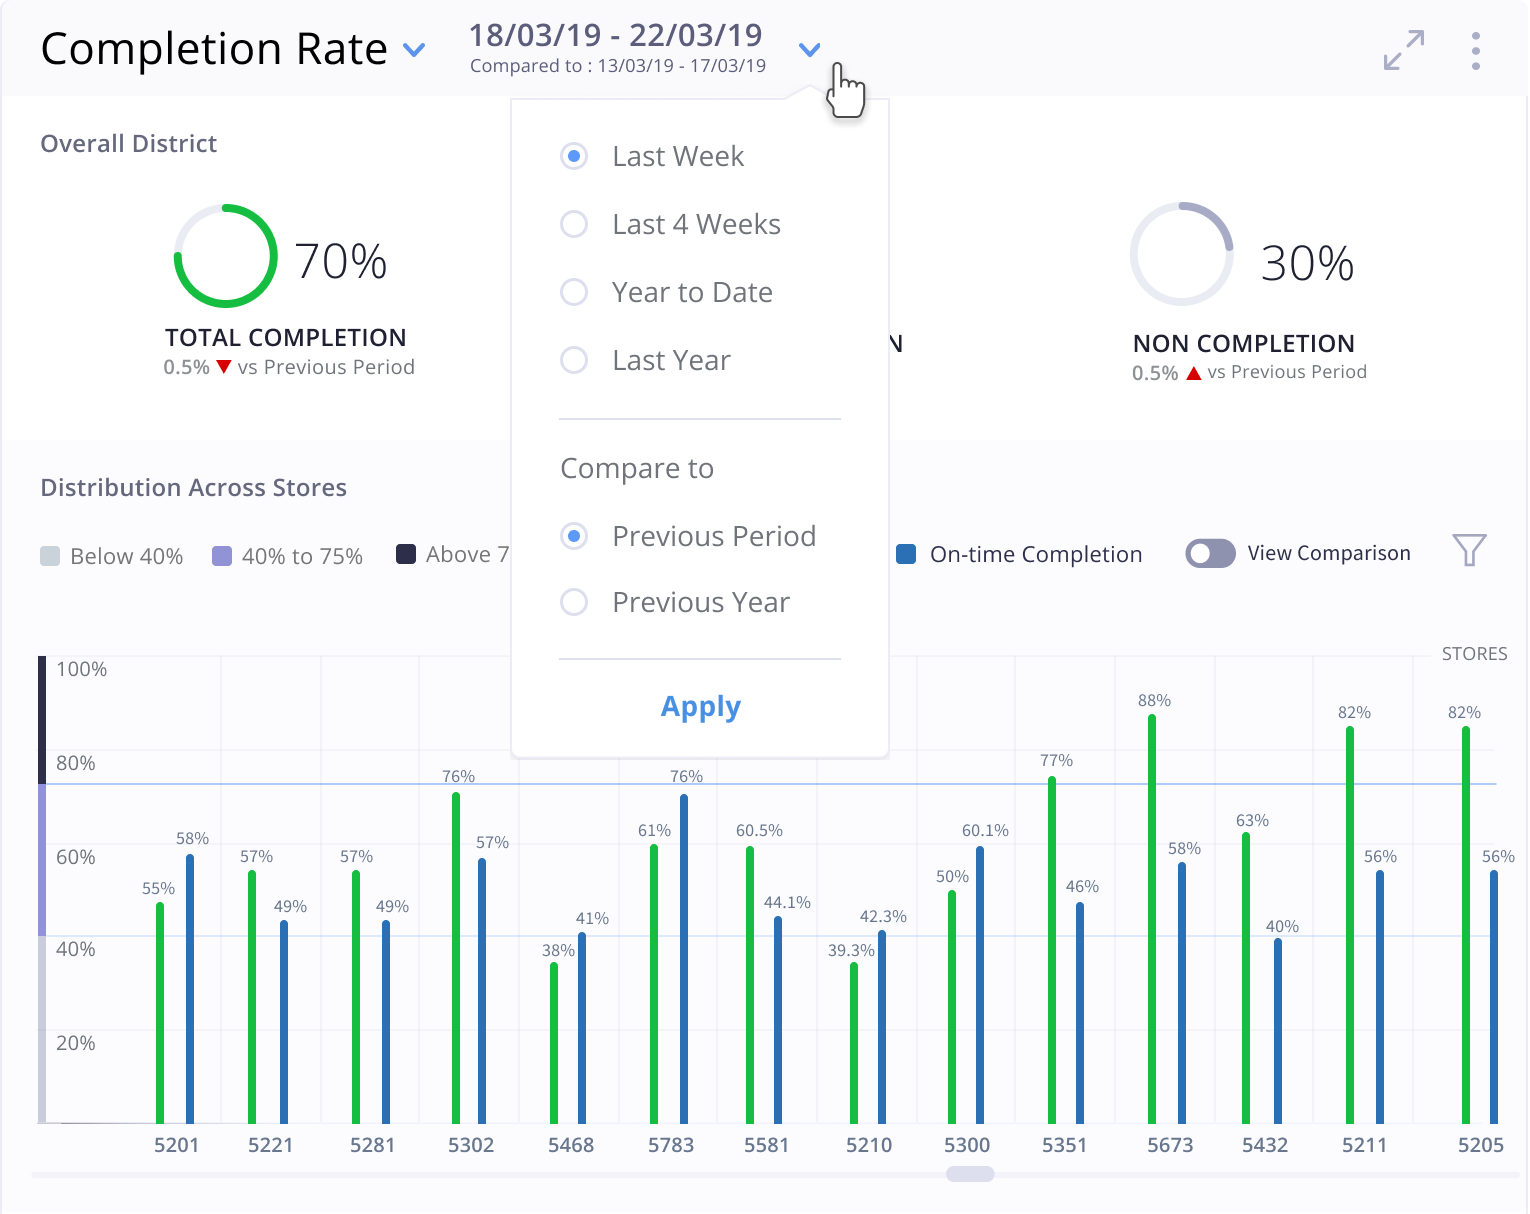
The widget displays overall completion and on-time completion rate. Data compared to the previous period helps the user to consistently monitor the performance.
- The thin blue line on the graph highlights the threshold to easily identify the good, bad and average performers. Users have the ability to set the threshold.
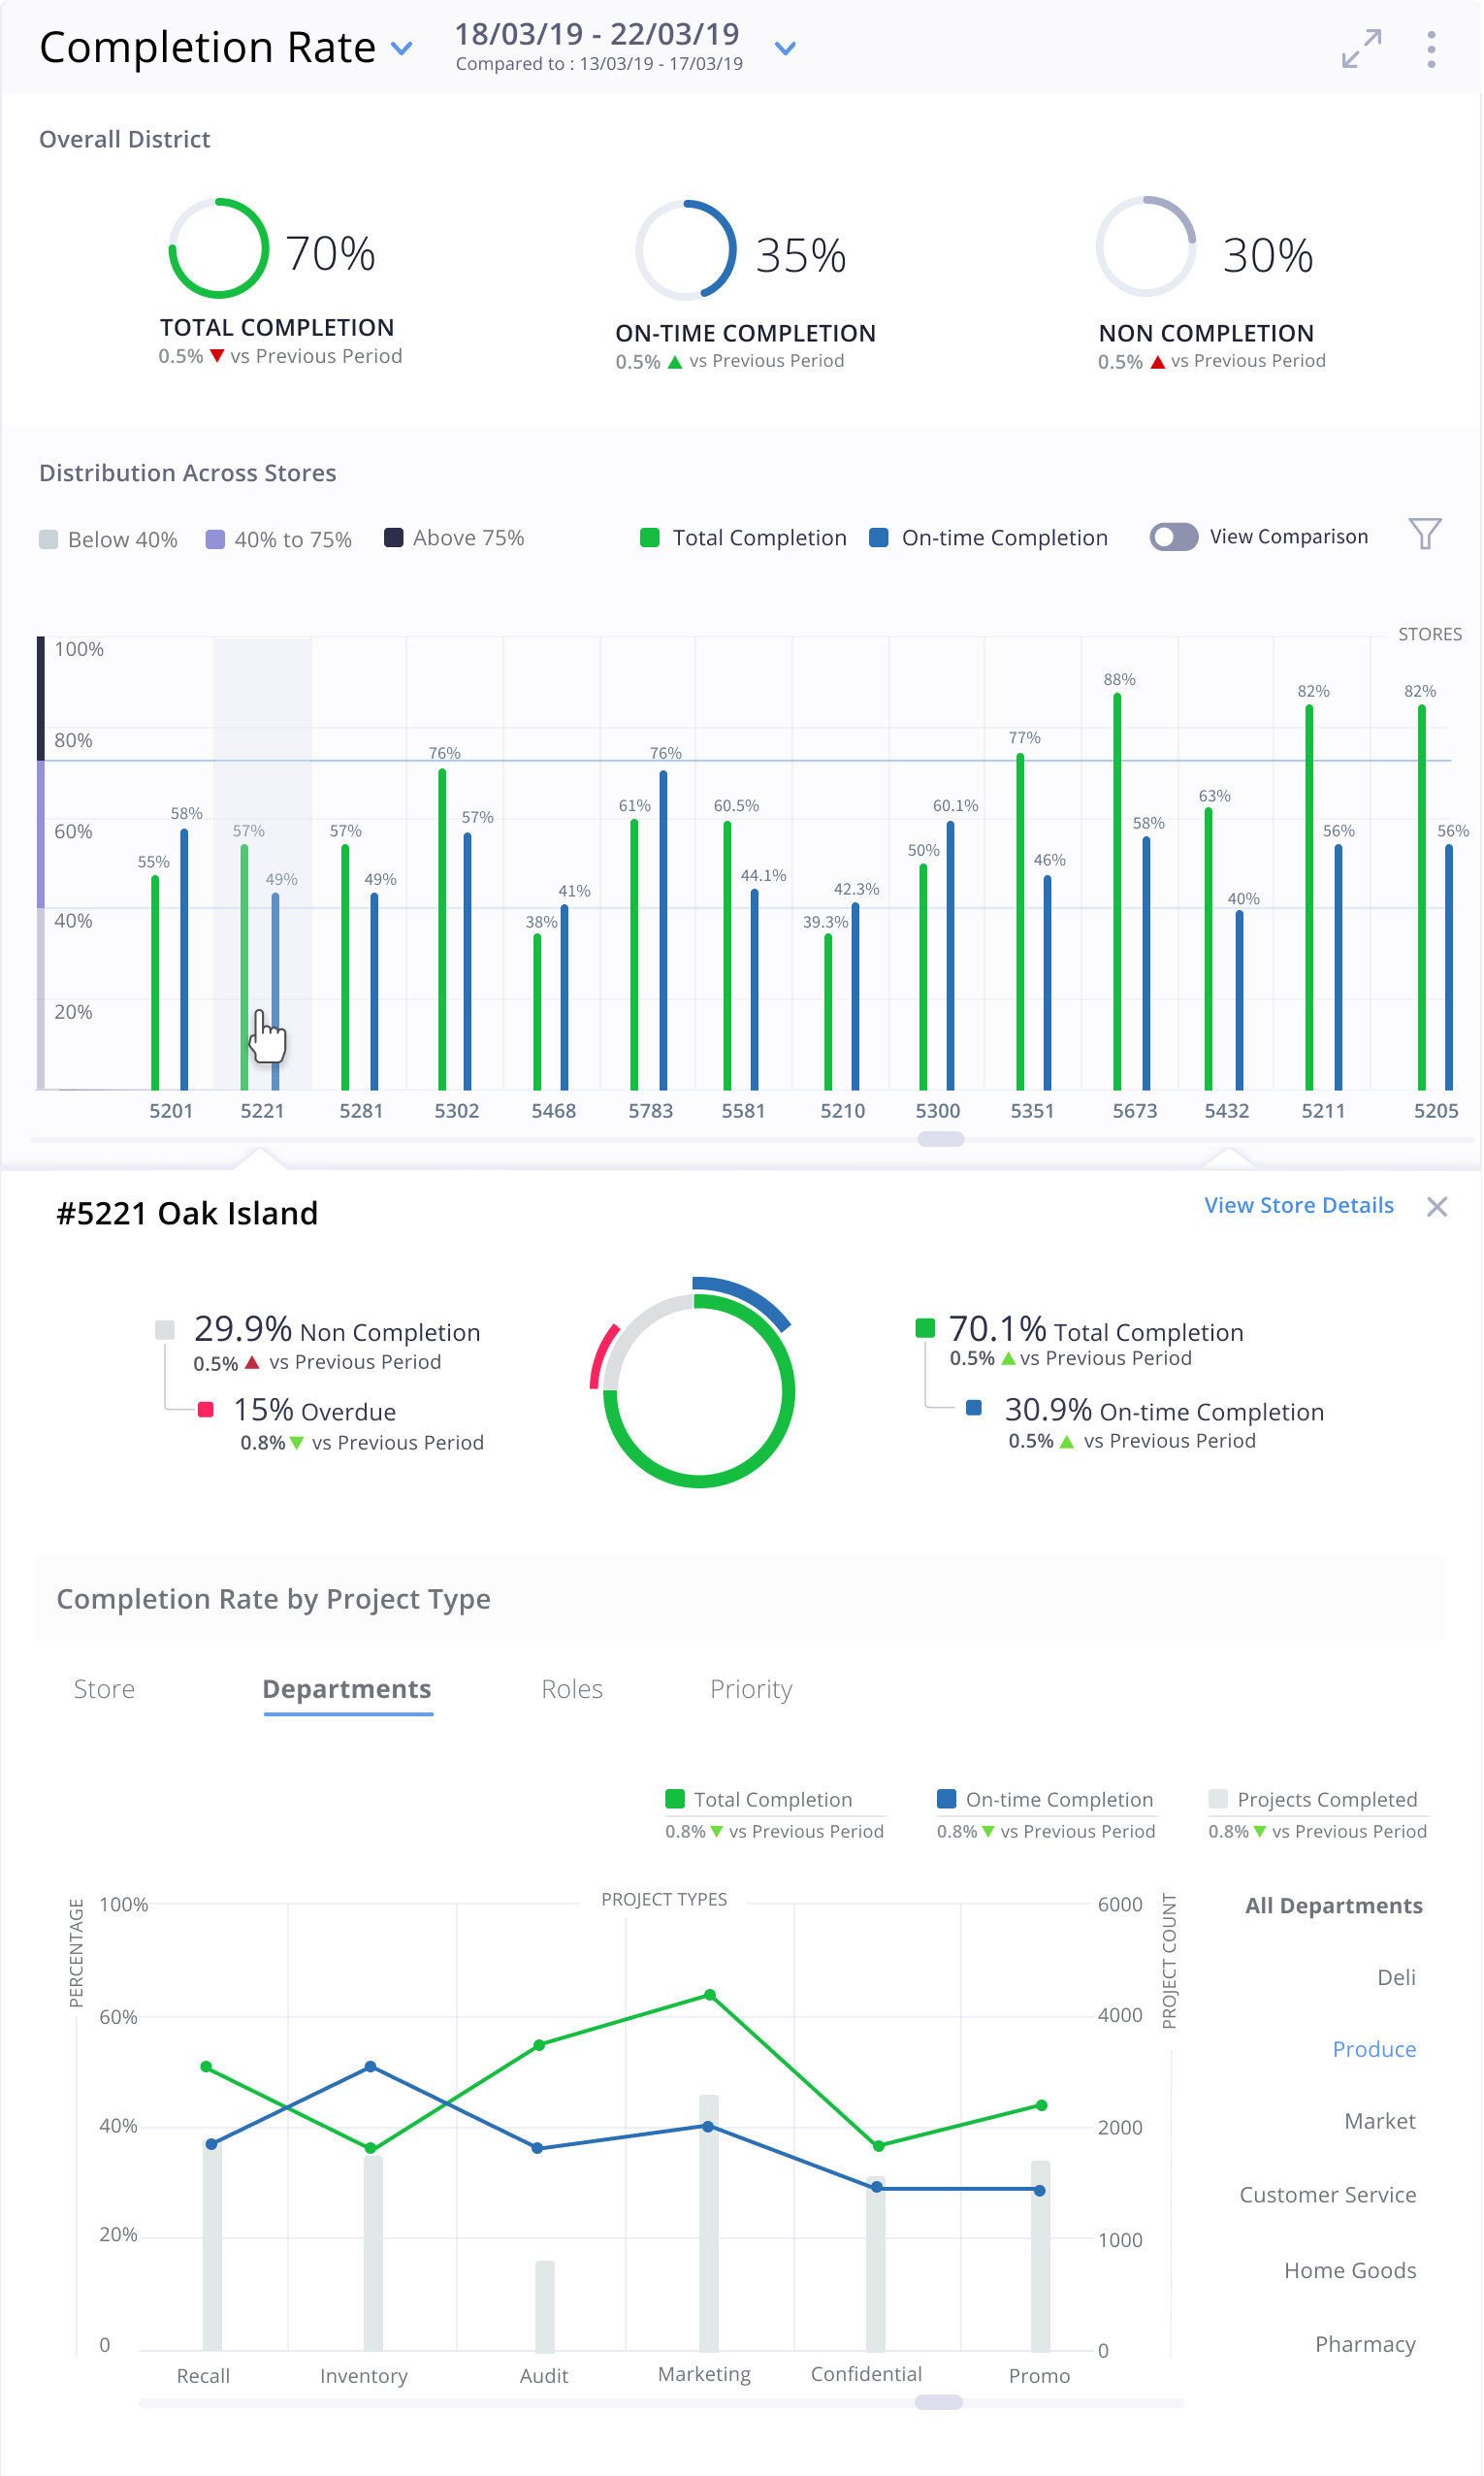
- On click of the bar/store, users are provided with a quick summary of individual store performance by different dimensions for the type of projects assigned.
The widget displays overall completion and on-time completion rate. Data compared to the previous period helps the user to consistently monitor the performance.
- The thin blue line on the graph highlights the threshold to easily identify the good, bad and average performers. Users have the ability to set the threshold.
- On click of the bar/store, users are provided with a quick summary of individual store performance by different dimensions for the type of projects assigned.
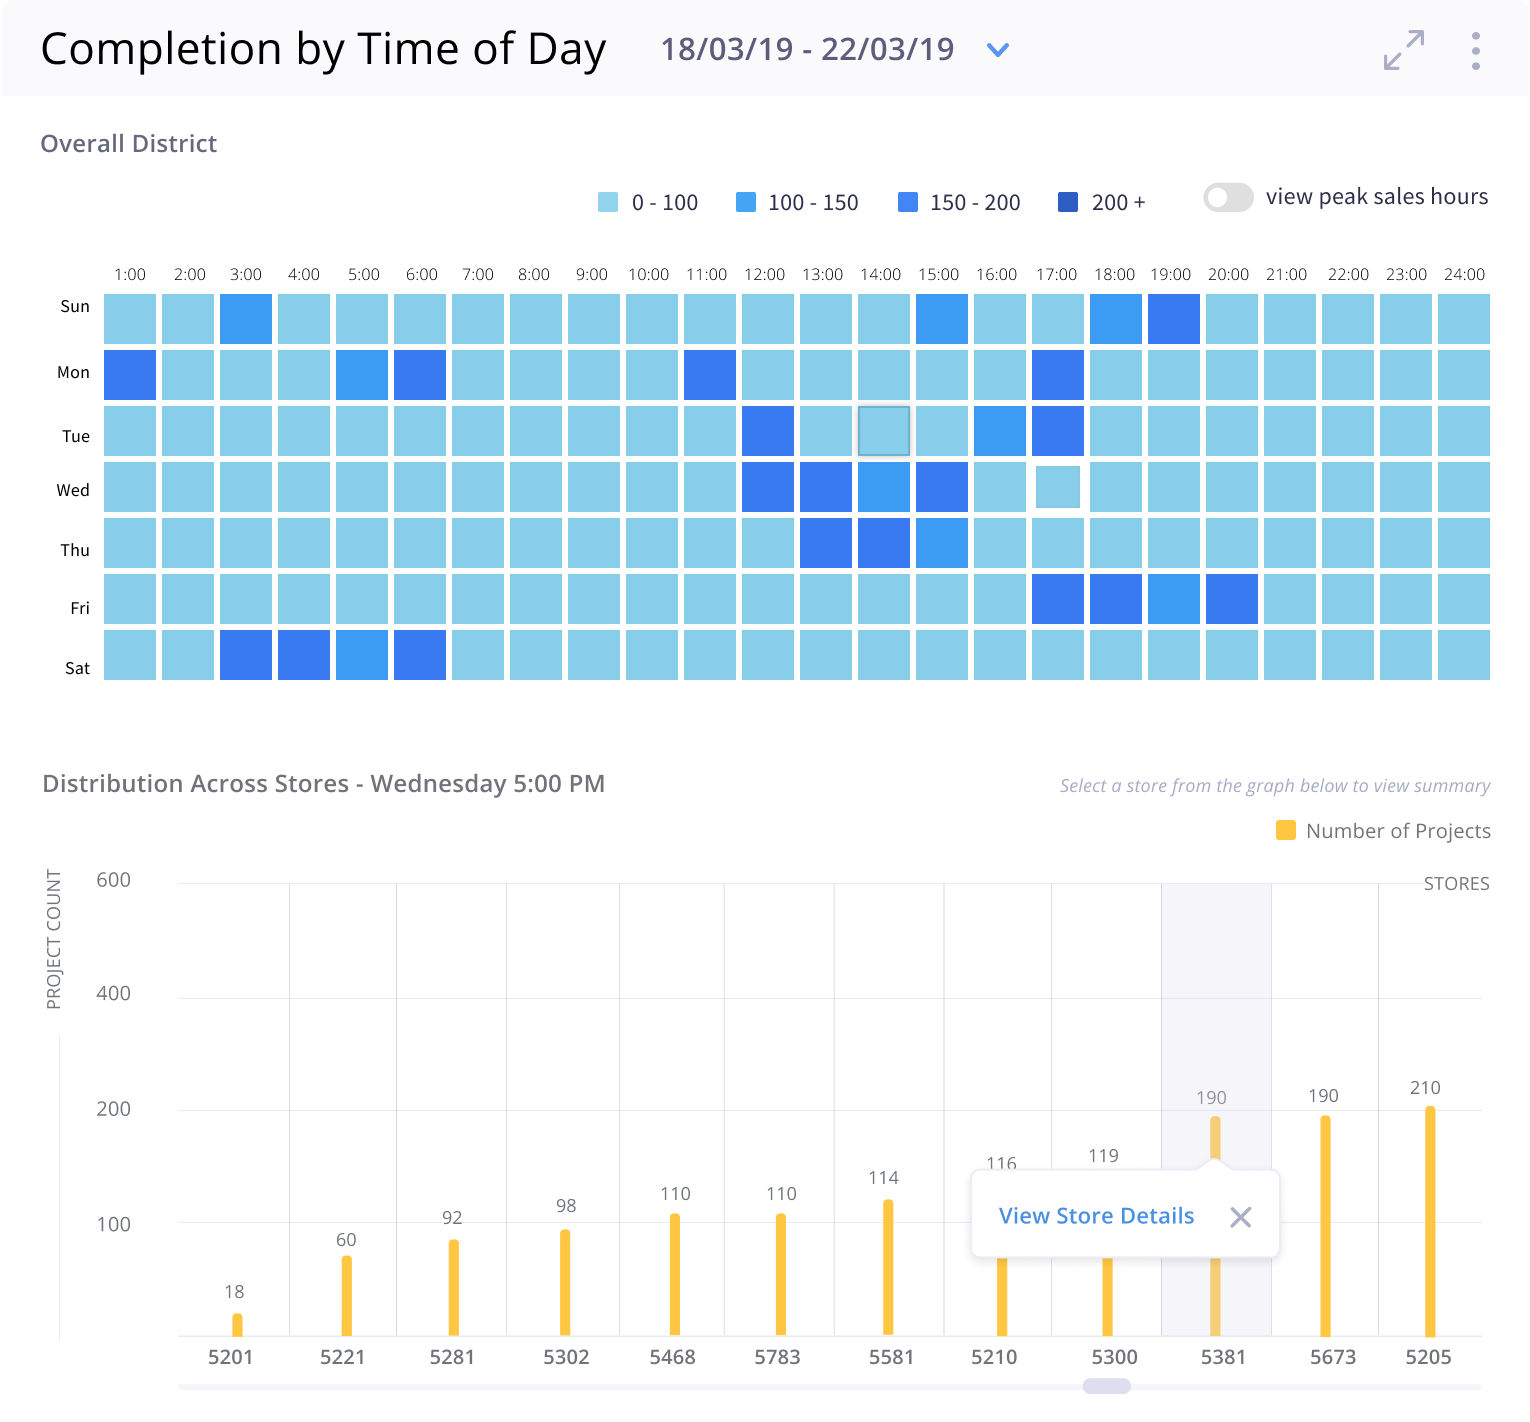
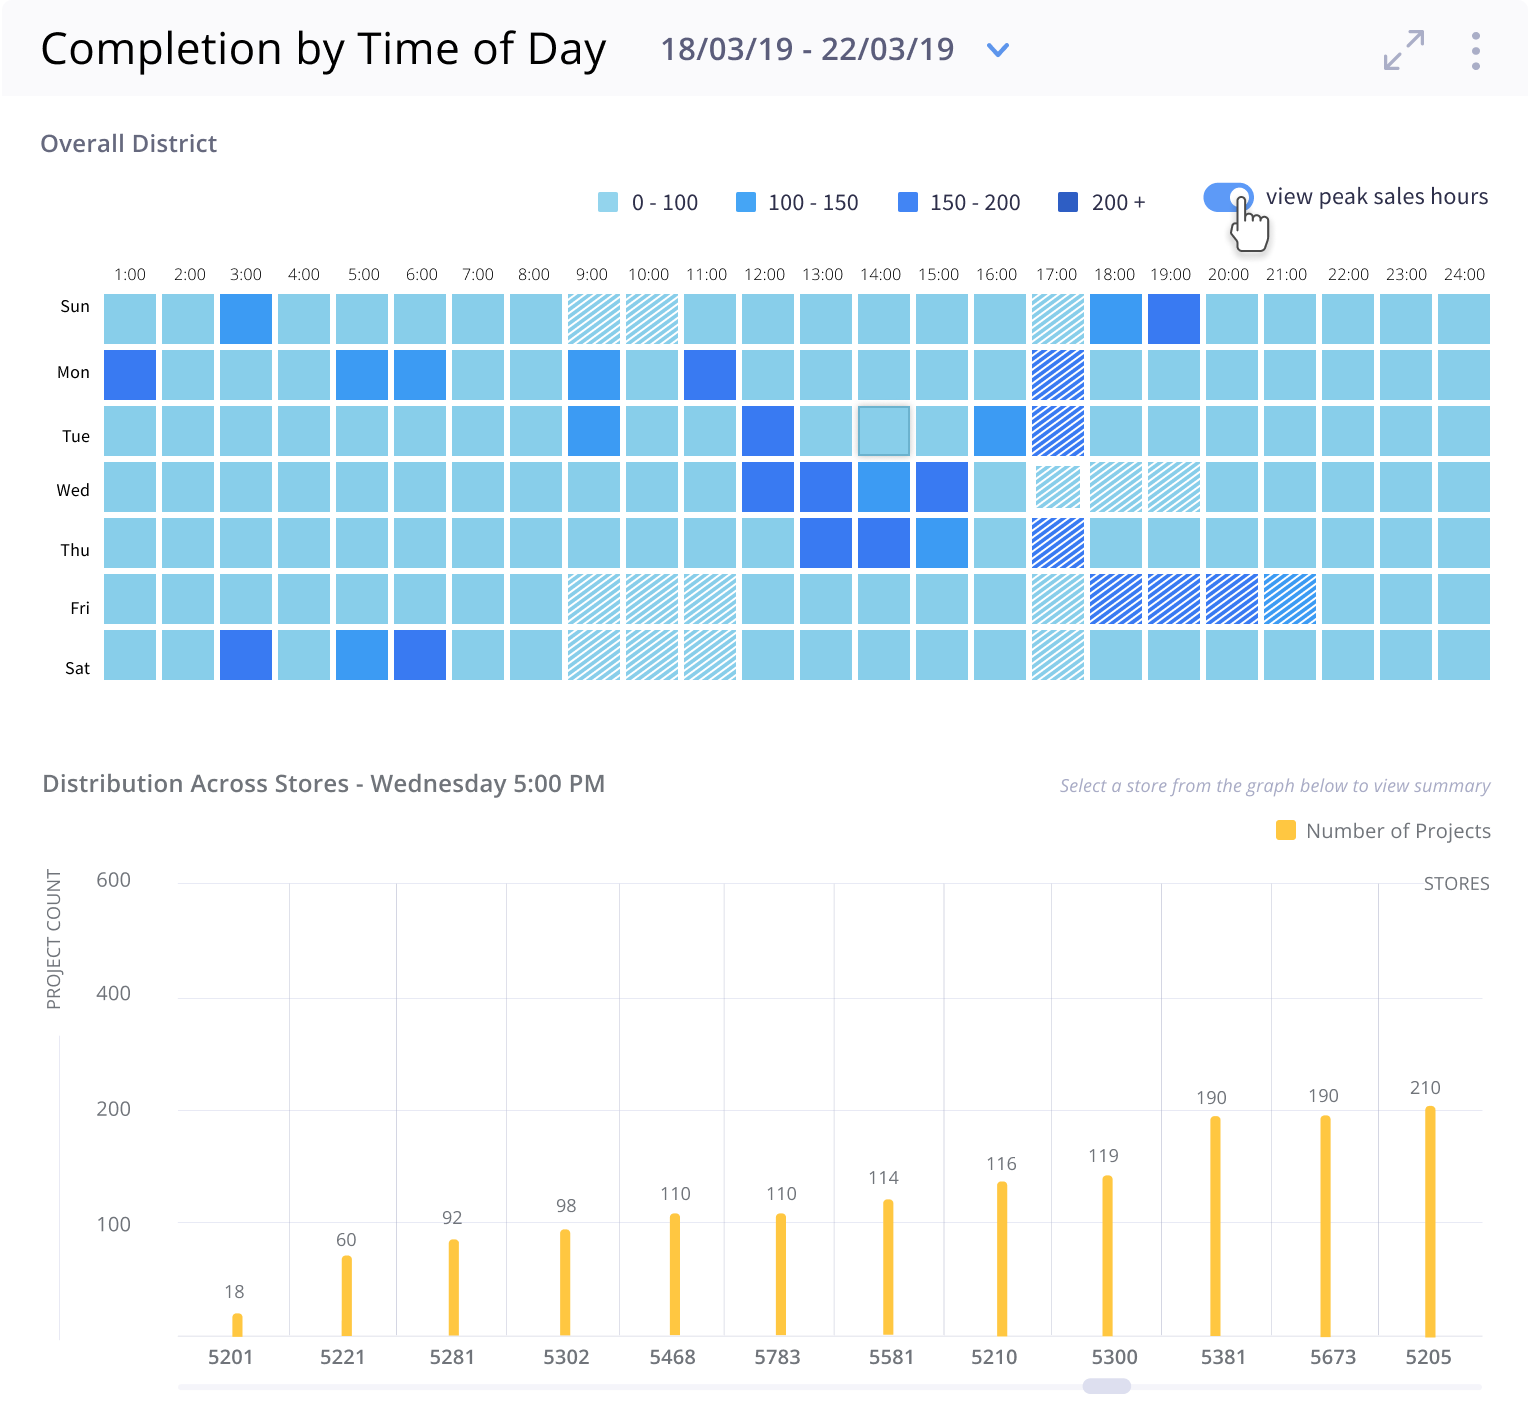
1.3 Completion by Time of Day - ( Store Operations)
1.3 Completion by Time of Day - ( Store Operations)
The metrics let the users identify the project execution on an hourly basis and compare it with peak sales hours ( in-store foot traffic ). This helps the District Managers to take effective measures to balance project executions and focus on in-store customer service.
The metrics let the users identify the project execution on an hourly basis and compare it with peak sales hours ( in-store foot traffic ). This helps the District Managers to take effective measures to balance project executions and focus on in-store customer service.
2. Recent Insights
2. Recent Insights
------------------
------------------
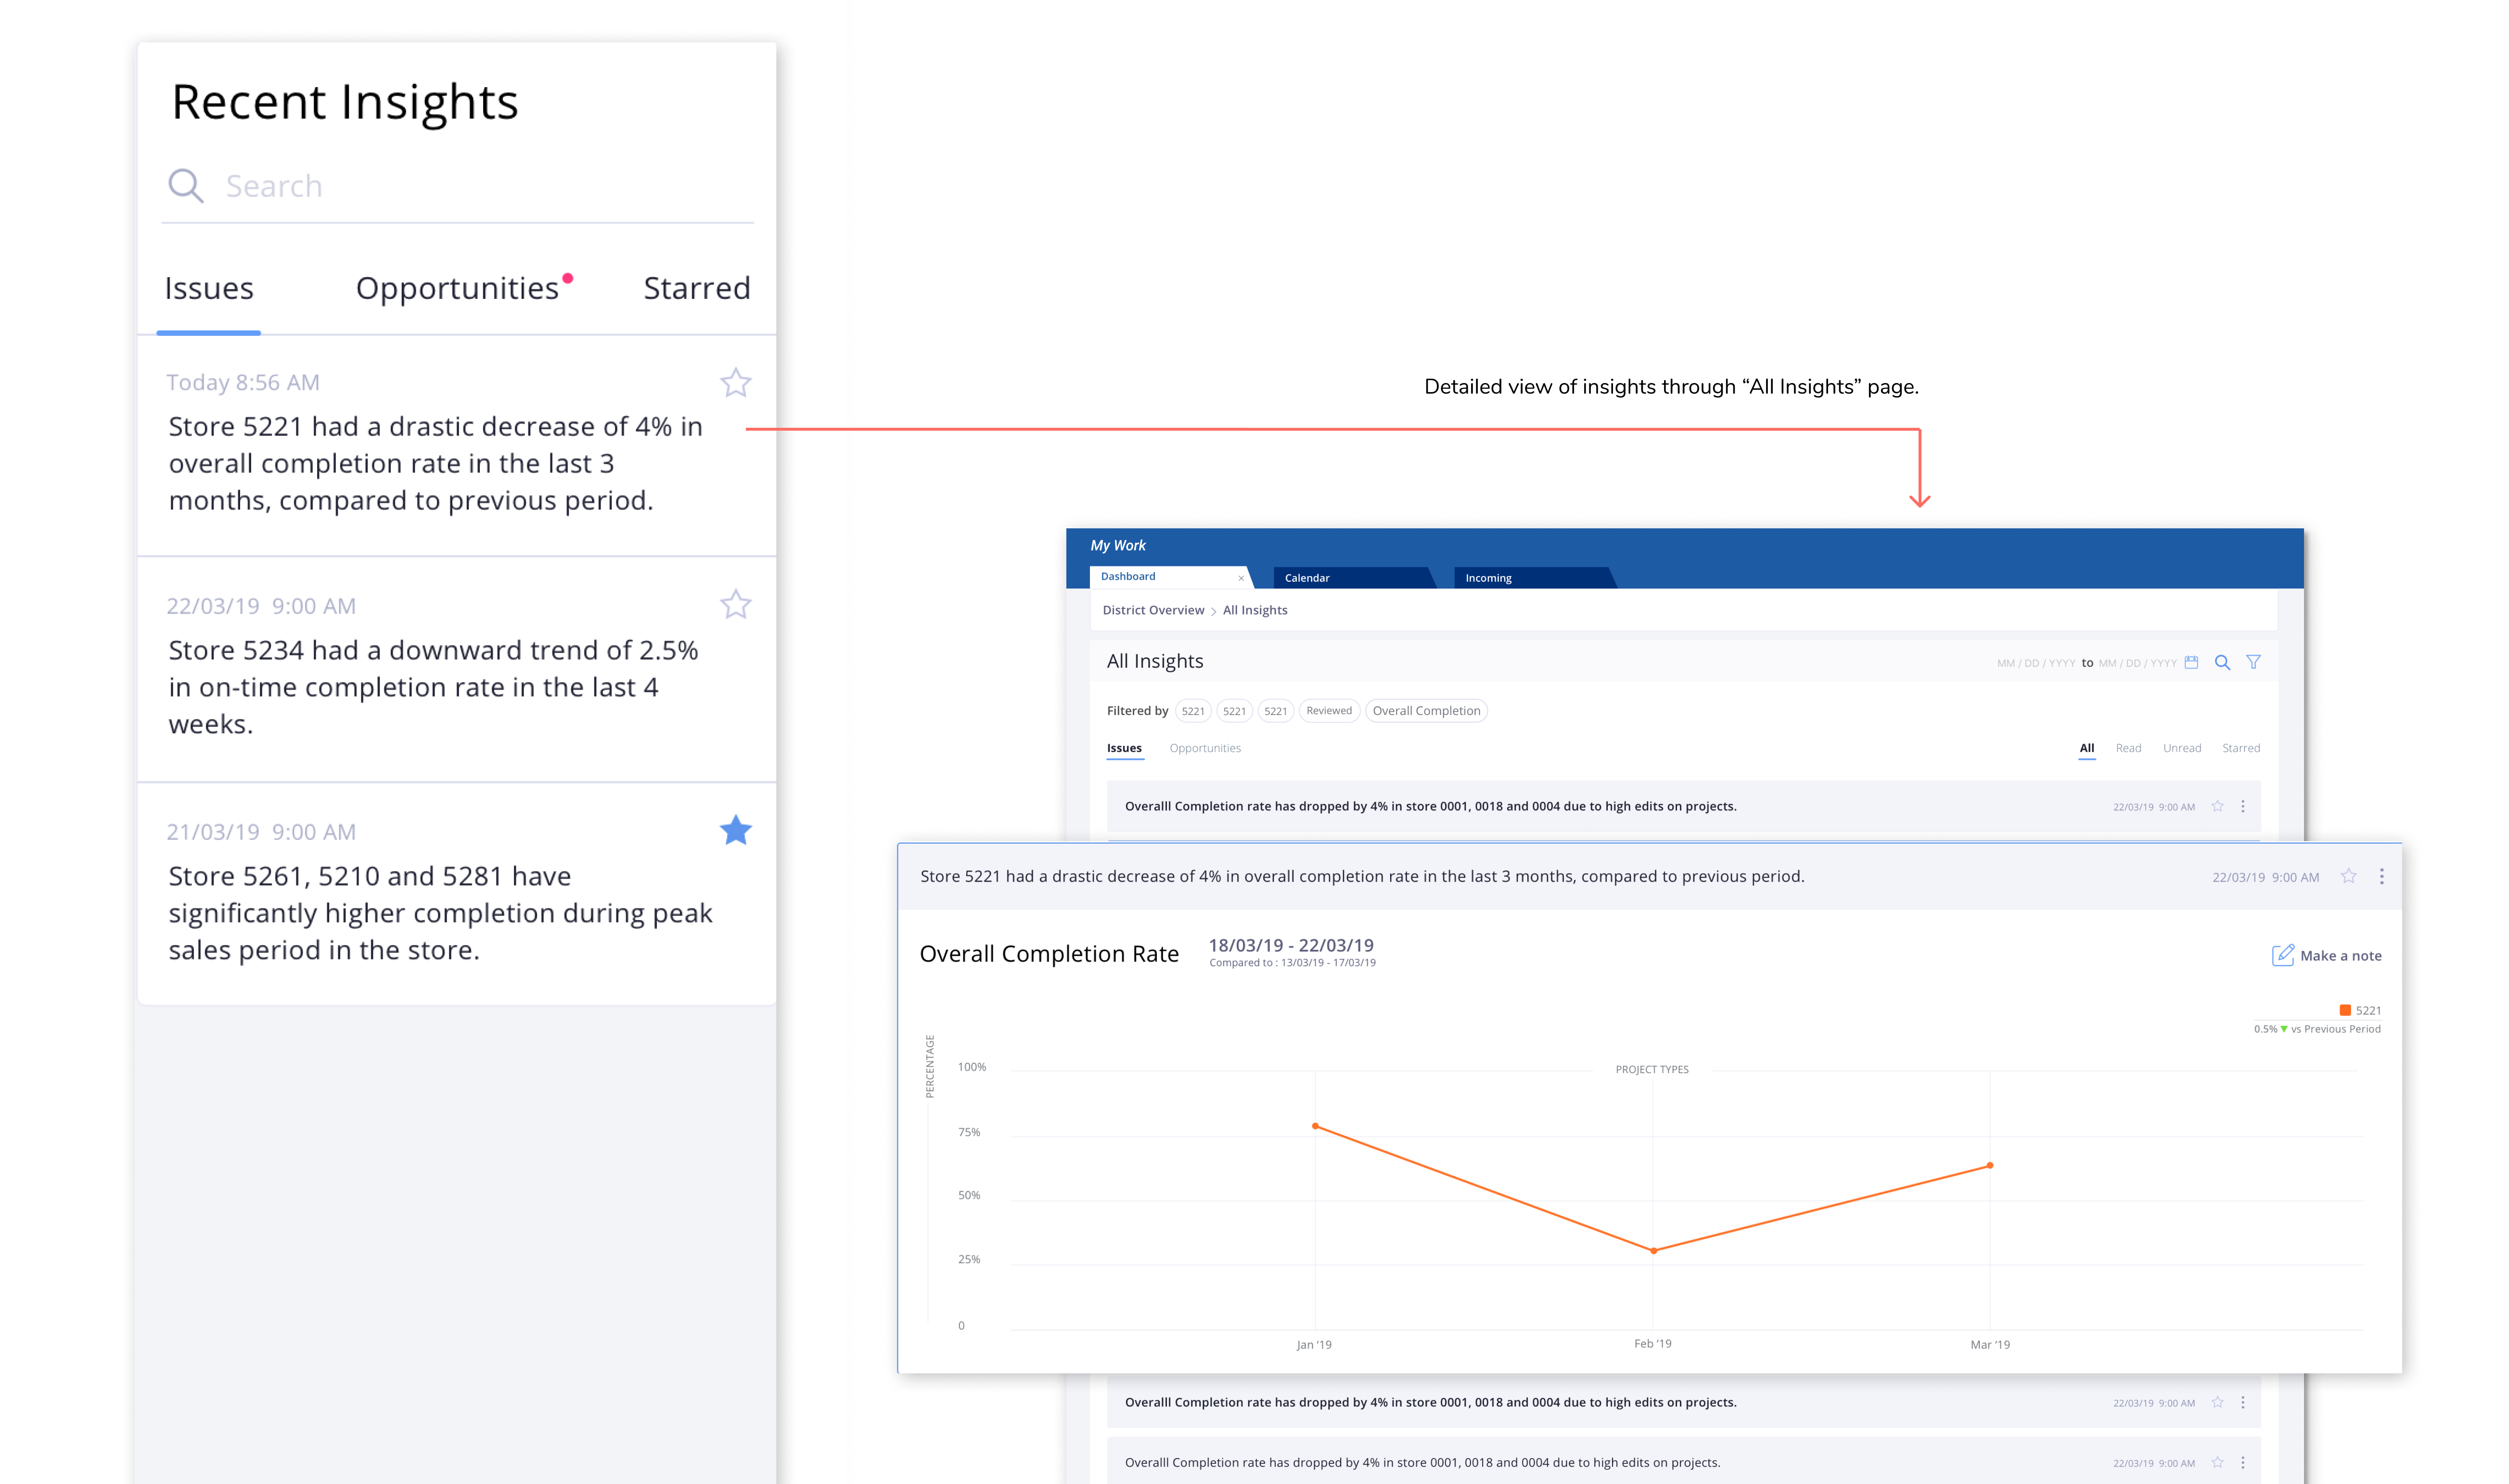
System generated insights provide quicker access to wins and shortfalls across all stores. Insights are categorized as issues and opportunities - Issues being risk and opportunities being best practices. The visual summary in the "All Insights" page focuses on exceptions and helps the users make quick decisions and take immediate actions to mitigate risk. Example :
- The completion rate has dropped by 4% in store 5261, 5210 and 5281 due to high edits on projects.
- Store 5221 has significantly higher completions during the peak sales periods.
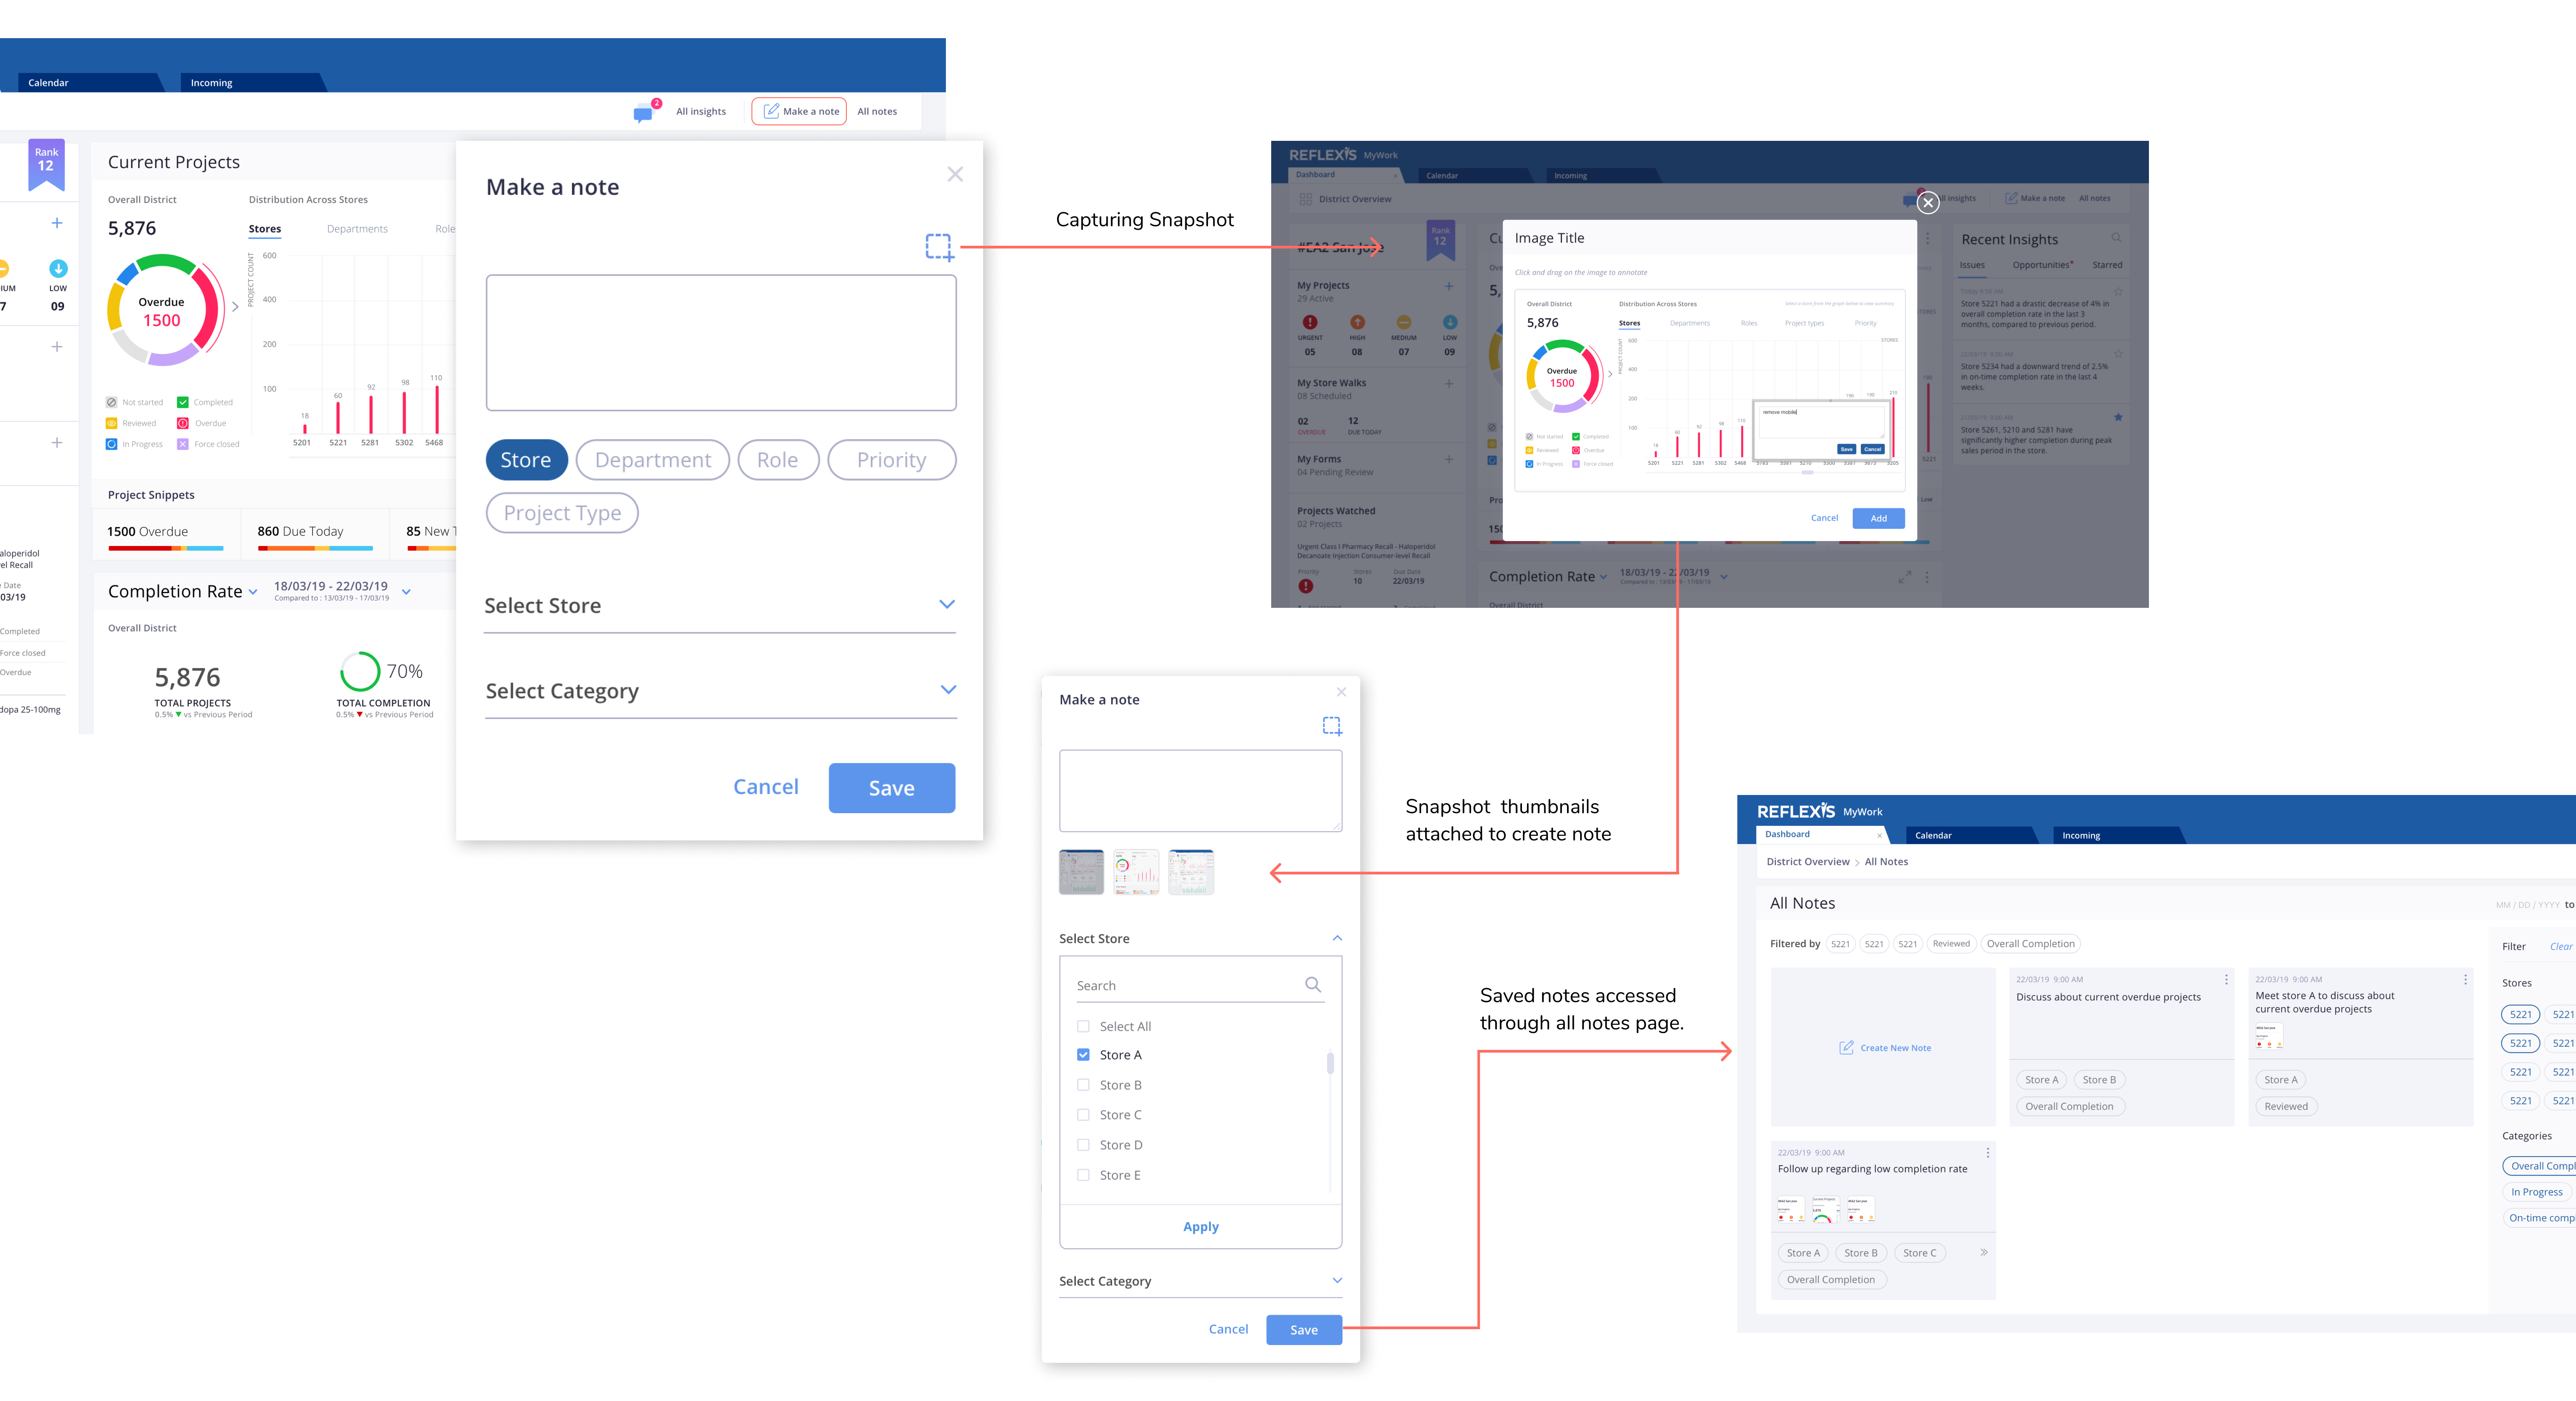
3. Make a note
3. Make a note
------------------
------------------
This enables the uses to monitor the store performance and easily make sharable notes on-the-go. The snapshot and annotation feature leaves no room for misinterpretation.
This enables the uses to monitor the store performance and easily make sharable notes on-the-go. The snapshot and annotation feature leaves no room for misinterpretation.
4. My to-do
4. My to-do
------------------
------------------
My to-do space gives quick visibility and easy access to District Manager's tasks like projects, store walks, and forms for self-compliance.
My to-do space gives quick visibility and easy access to District Manager's tasks like projects, store walks, and forms for self-compliance.
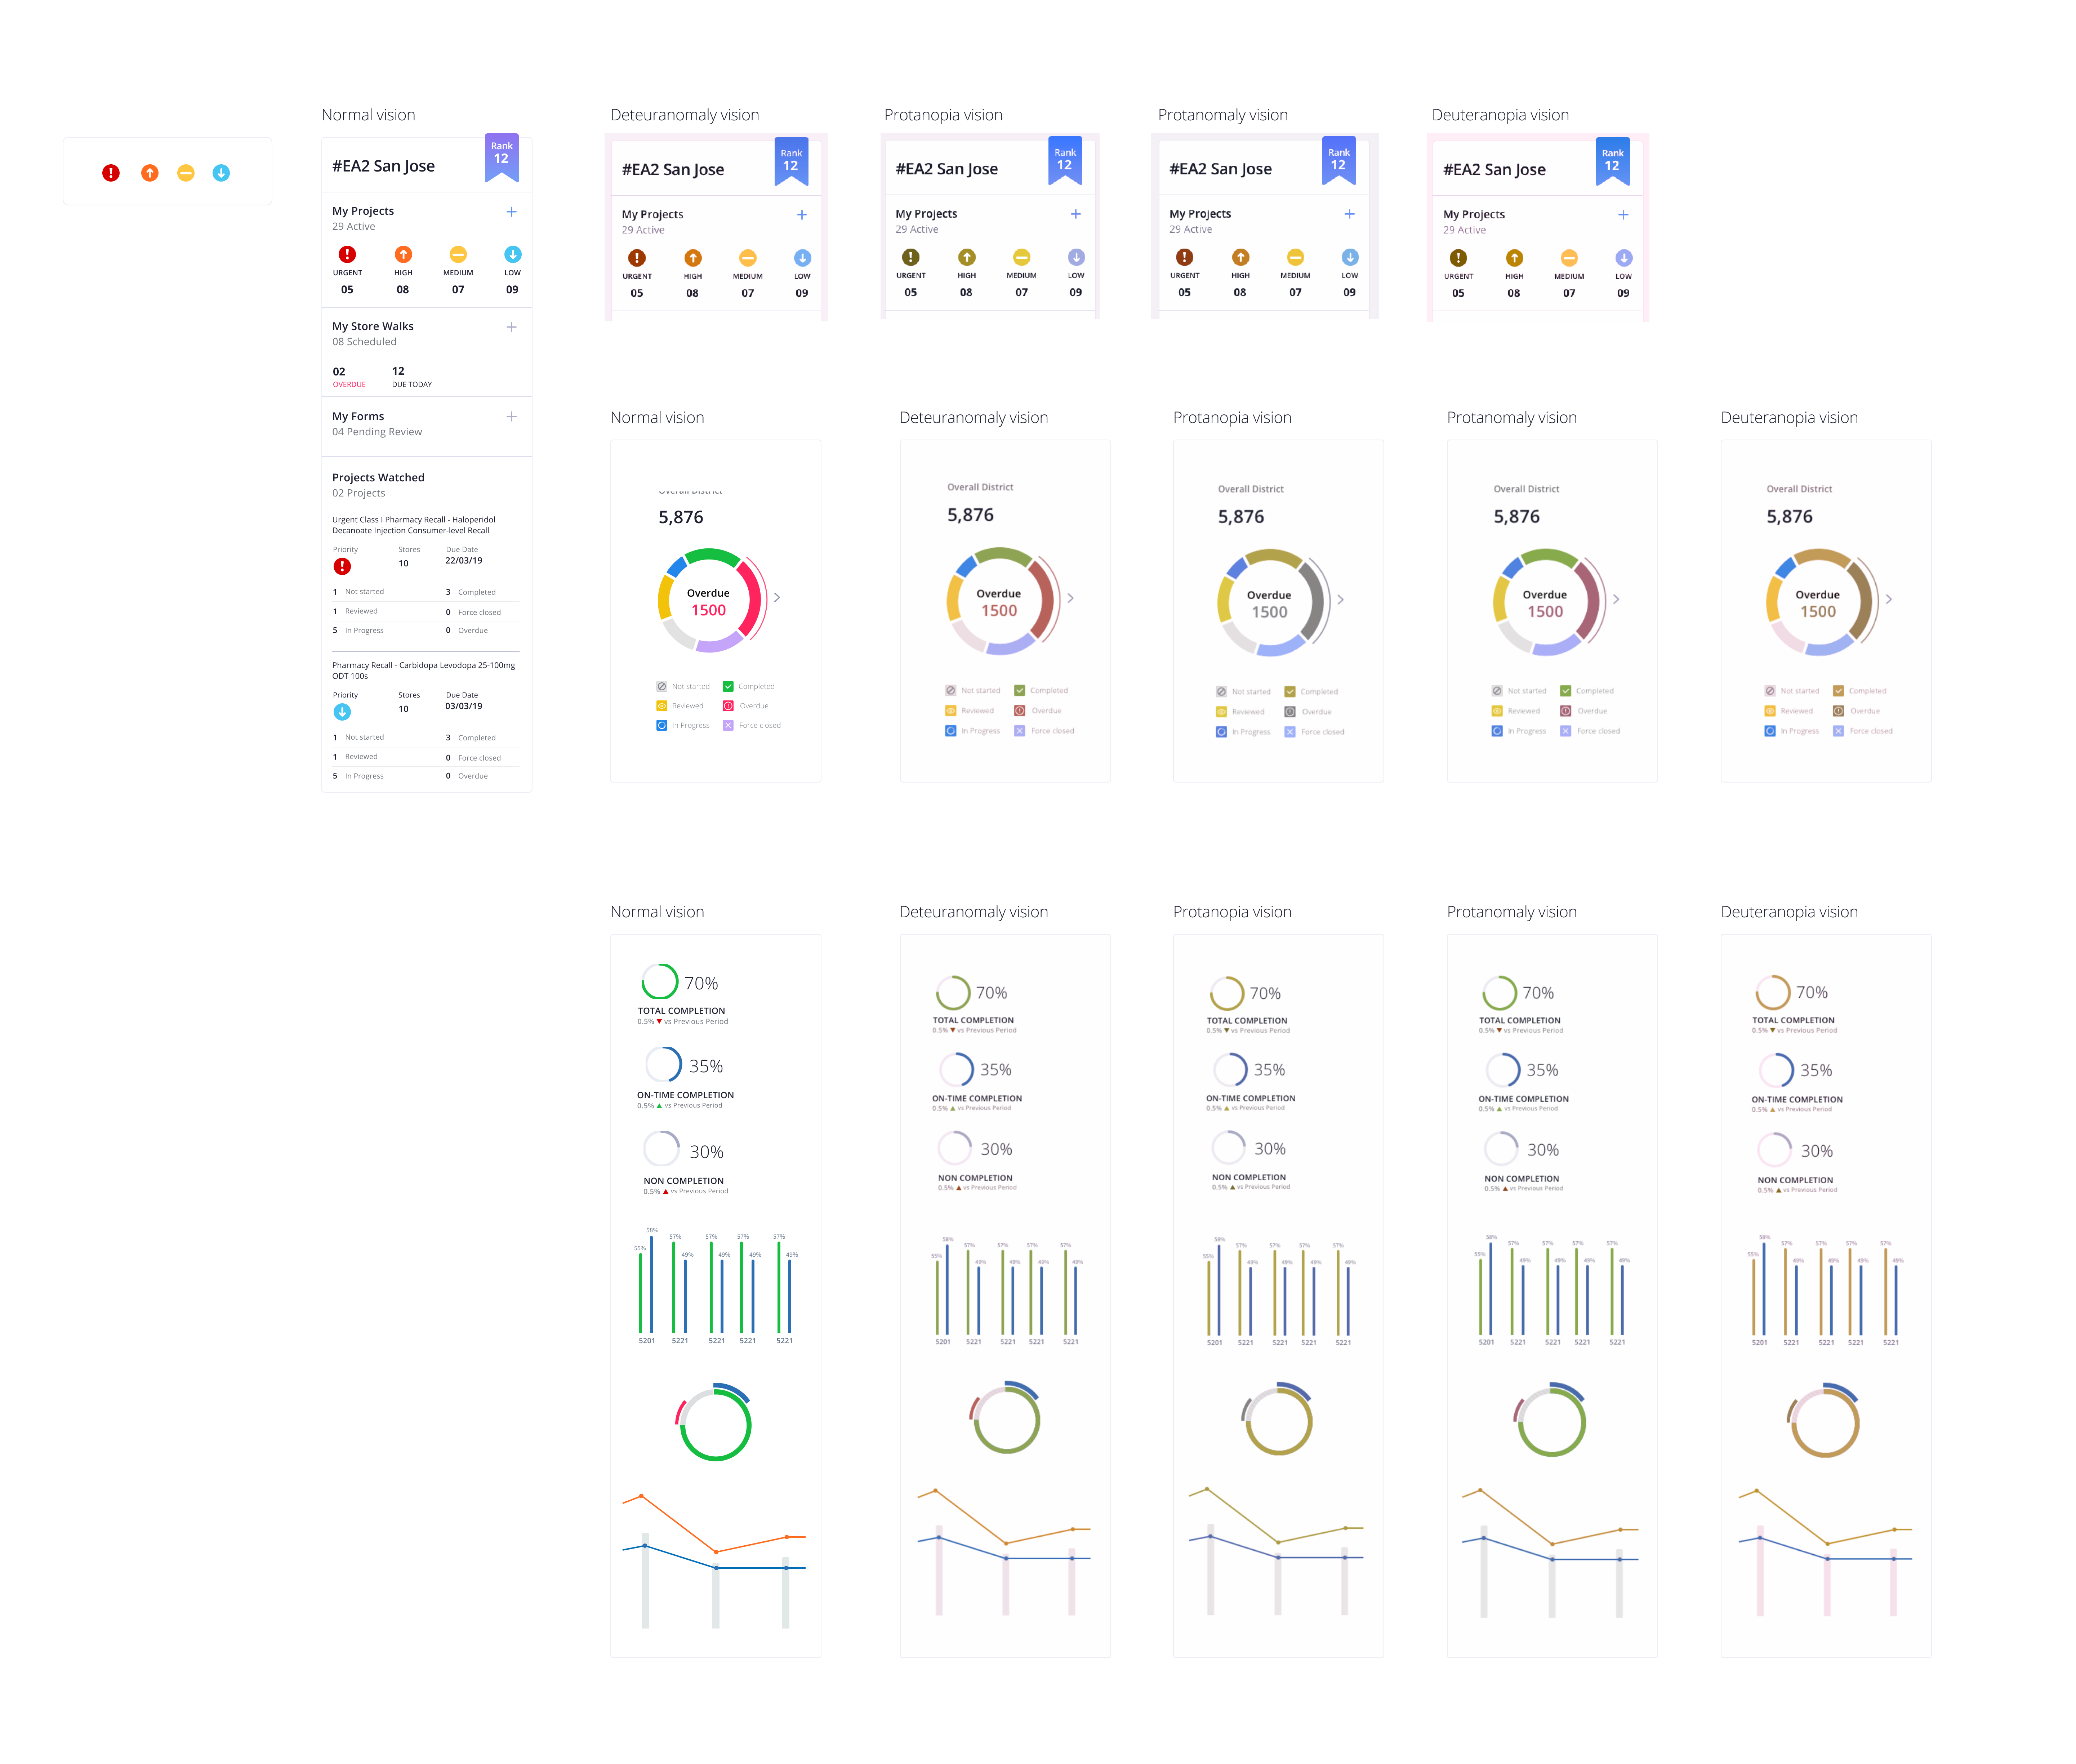
Ensuring WCAG compliance for an inclusive design.
Ensuring WCAG compliance for an inclusive design.
------------------
teenajose19@gmail.com / +91 62824 12702